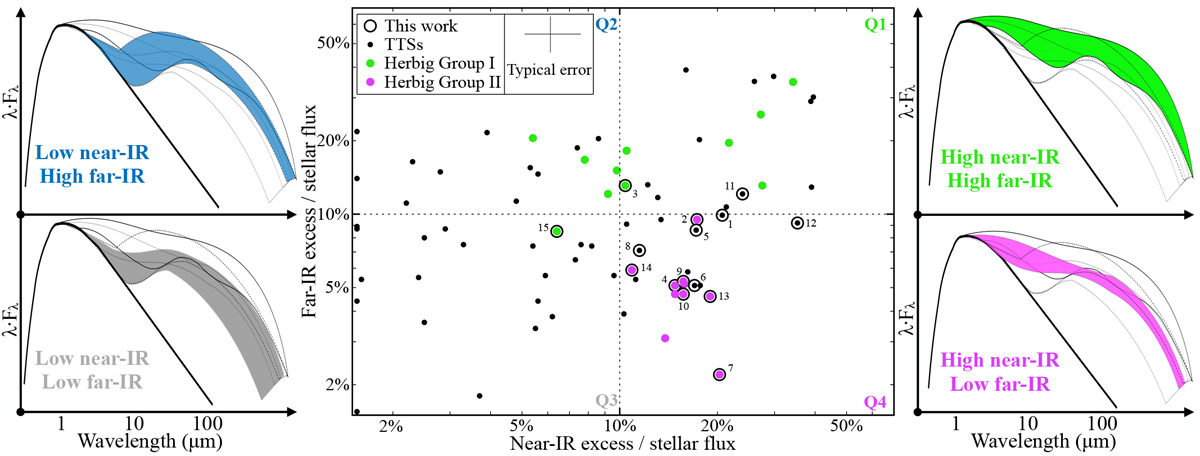
Fig. 1
Download original image
NIR vs. FIR excess for an illustrative sample of stars with VLT/SPHERE images available. Both excesses are shown in fraction of the stellar luminosity. The dashed lines indicate the ideal separation between low and high excesses determining four quadrants. The range of IR excess exhibited by the targets of each quadrant is shown laterally. Target numbering refers to Table 1.
Current usage metrics show cumulative count of Article Views (full-text article views including HTML views, PDF and ePub downloads, according to the available data) and Abstracts Views on Vision4Press platform.
Data correspond to usage on the plateform after 2015. The current usage metrics is available 48-96 hours after online publication and is updated daily on week days.
Initial download of the metrics may take a while.