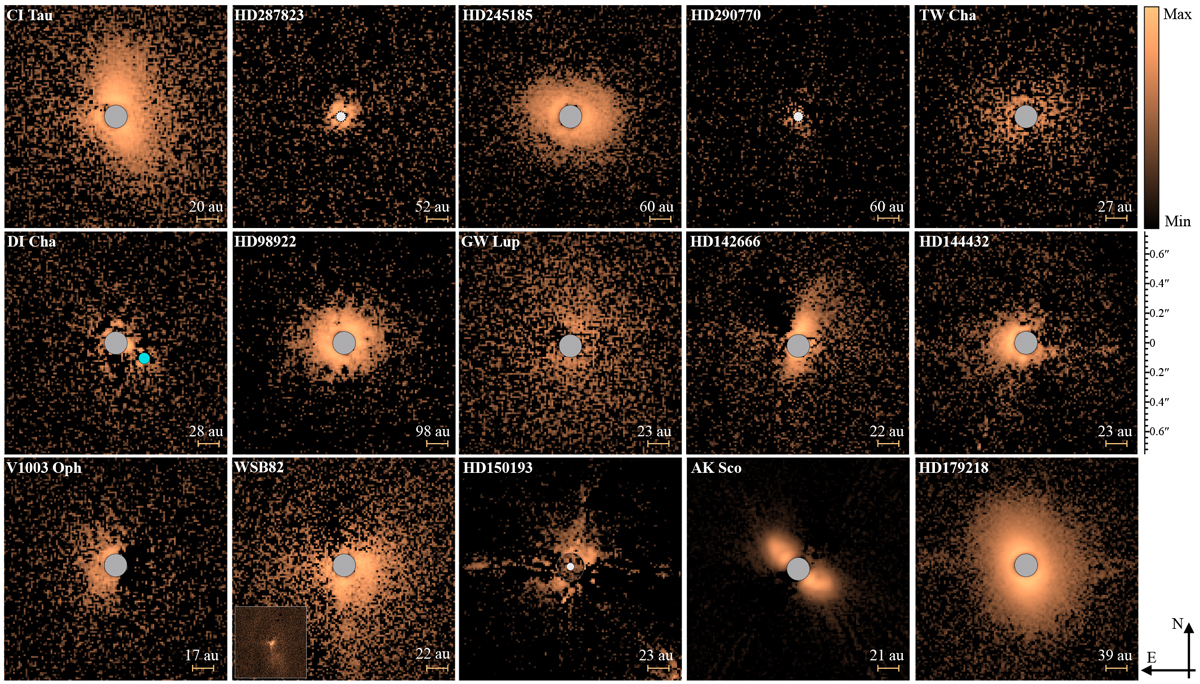
Fig. 2
Download original image
Imagery of the sample. For each source, the Qϕ map is shown with an arbitrary logarithmic color stretch. The relative brightness of the individual disks can be evaluated from Fig. 3. All images have the same angular field (1.5′′), and the physical scale is indicated by the bar in each panel. The gray circle in the center of a map indicates the coronagraph. Smaller sized white circles denote the angular resolution of non-coronagraphic images. Stellar companionsin the field are indicated by cyan circles. The image of HD 150193 is a combination of coronagraphic J-band (main image) and non-coronagraphic H-band (inner inset at 0.2′′) images. The diffraction spikes in this source are evident toward the four cardinal points. The inset image of WSB82 shows a larger field (7′′) of the same image.
Current usage metrics show cumulative count of Article Views (full-text article views including HTML views, PDF and ePub downloads, according to the available data) and Abstracts Views on Vision4Press platform.
Data correspond to usage on the plateform after 2015. The current usage metrics is available 48-96 hours after online publication and is updated daily on week days.
Initial download of the metrics may take a while.