Fig. 3
Download original image
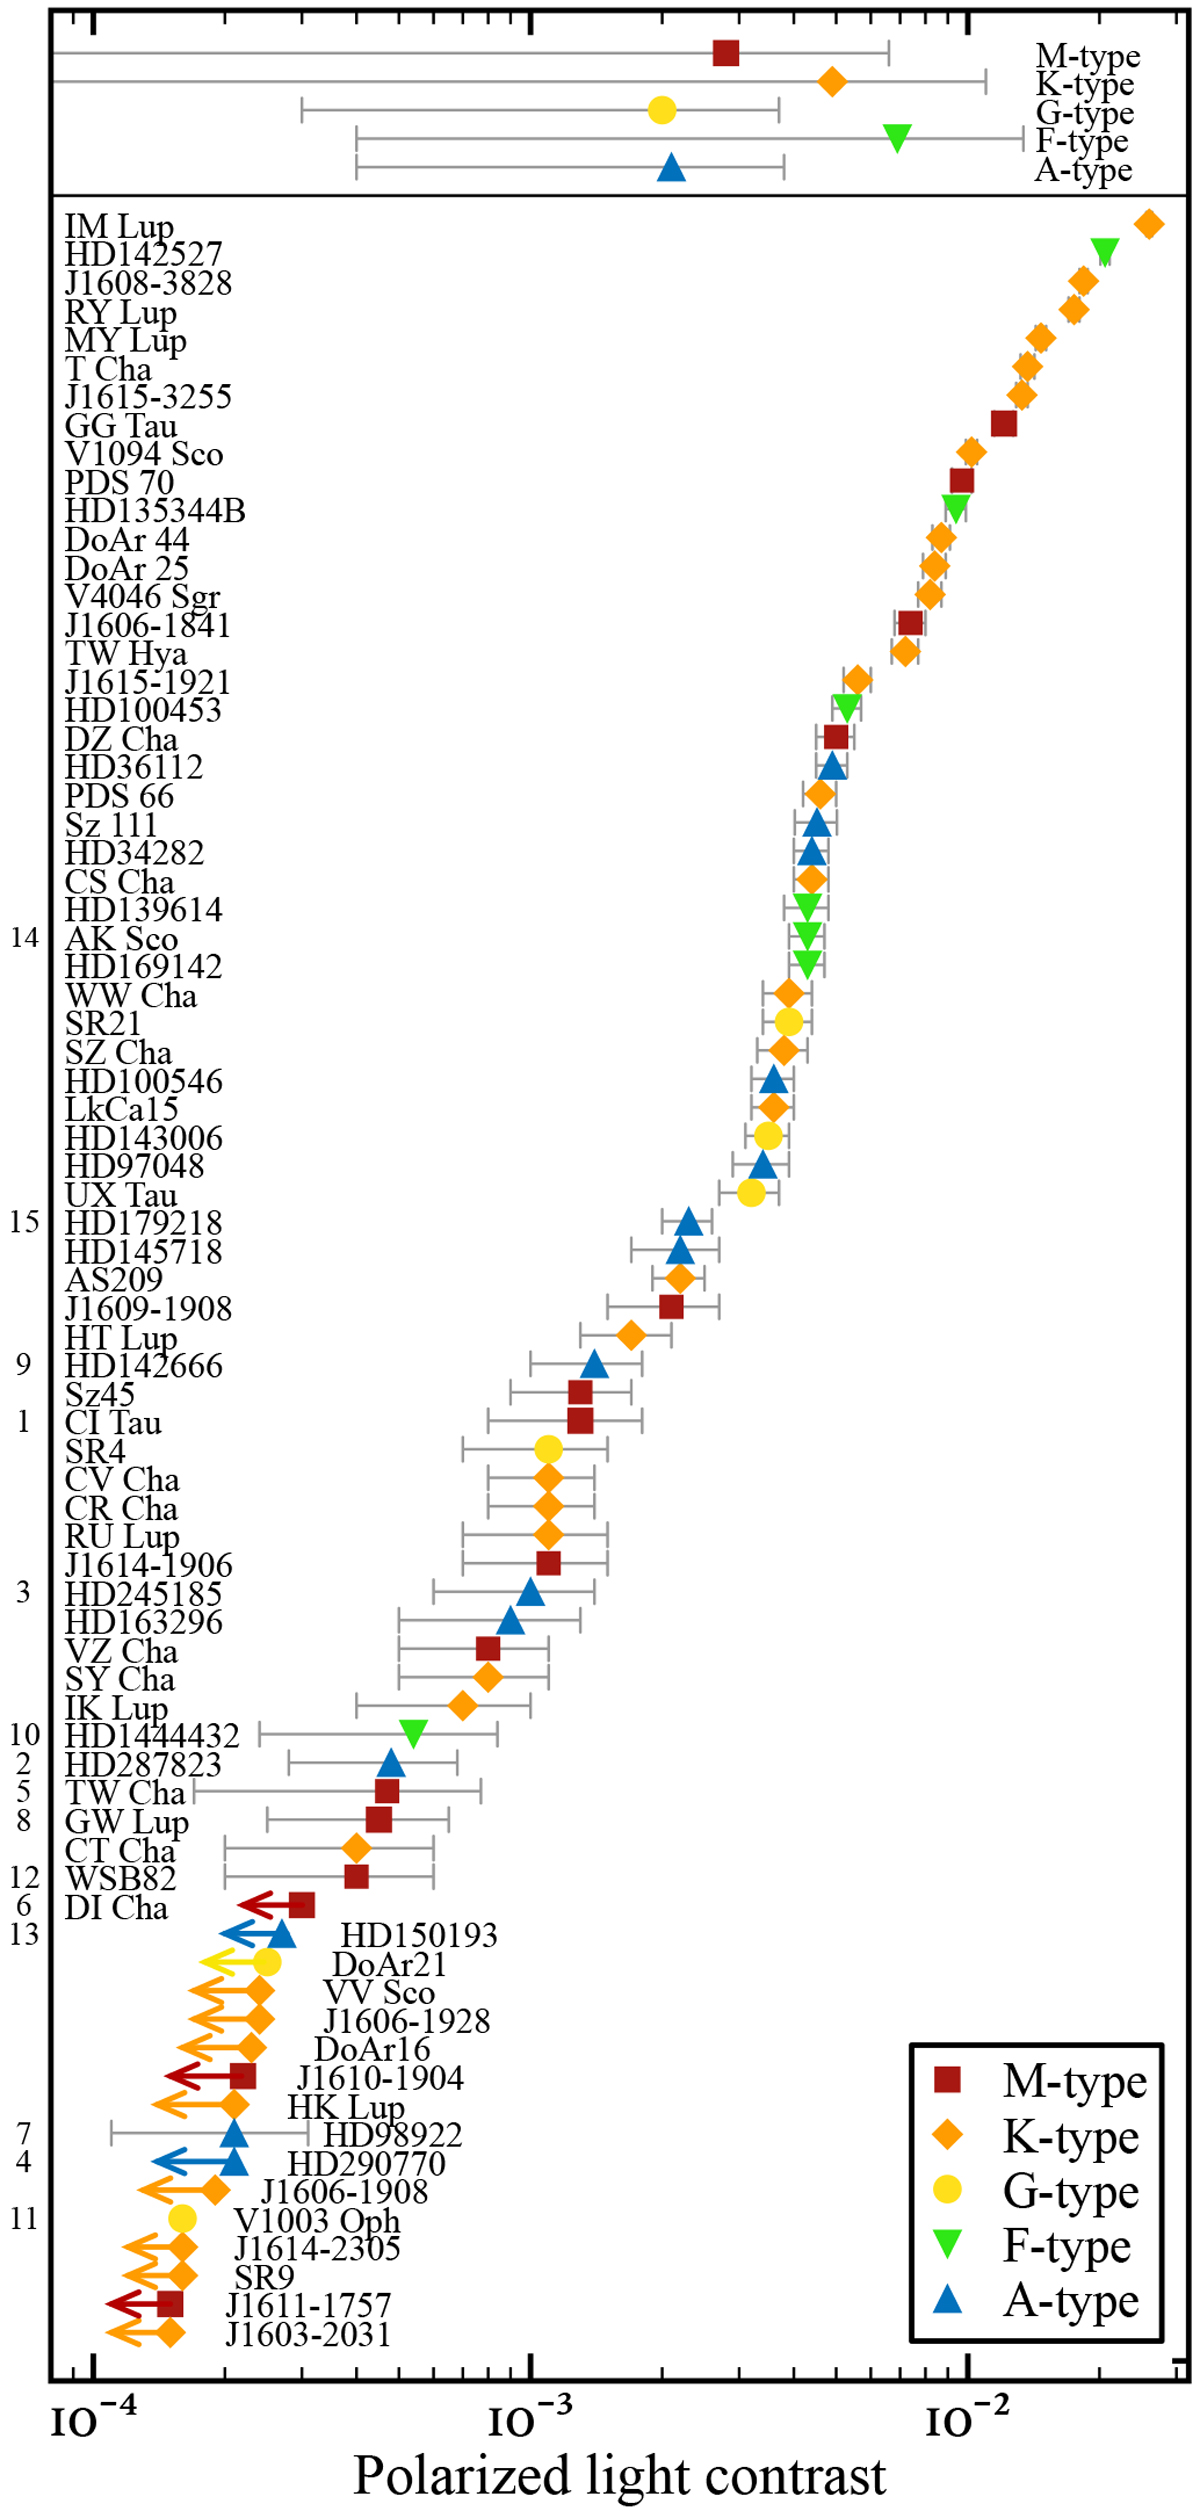
Disk brightness in scattered light. The resolved polarized-to-stellar light contrast of the sample from this work is compared with an illustrative sample from the literature. Different symbols indicate different spectral types. For simplicity, B9 stars are combined with A stars. The average of the spectral types is shown to the top. The numbers to the left indicate the sources from this work as from Table 1. Bars and arrows on the individual sources indicate 3σ uncertainties and upper limits, respectively. The bars on the average of spectral types indicate the 1σ dispersion.
Current usage metrics show cumulative count of Article Views (full-text article views including HTML views, PDF and ePub downloads, according to the available data) and Abstracts Views on Vision4Press platform.
Data correspond to usage on the plateform after 2015. The current usage metrics is available 48-96 hours after online publication and is updated daily on week days.
Initial download of the metrics may take a while.