Fig. 4
Download original image
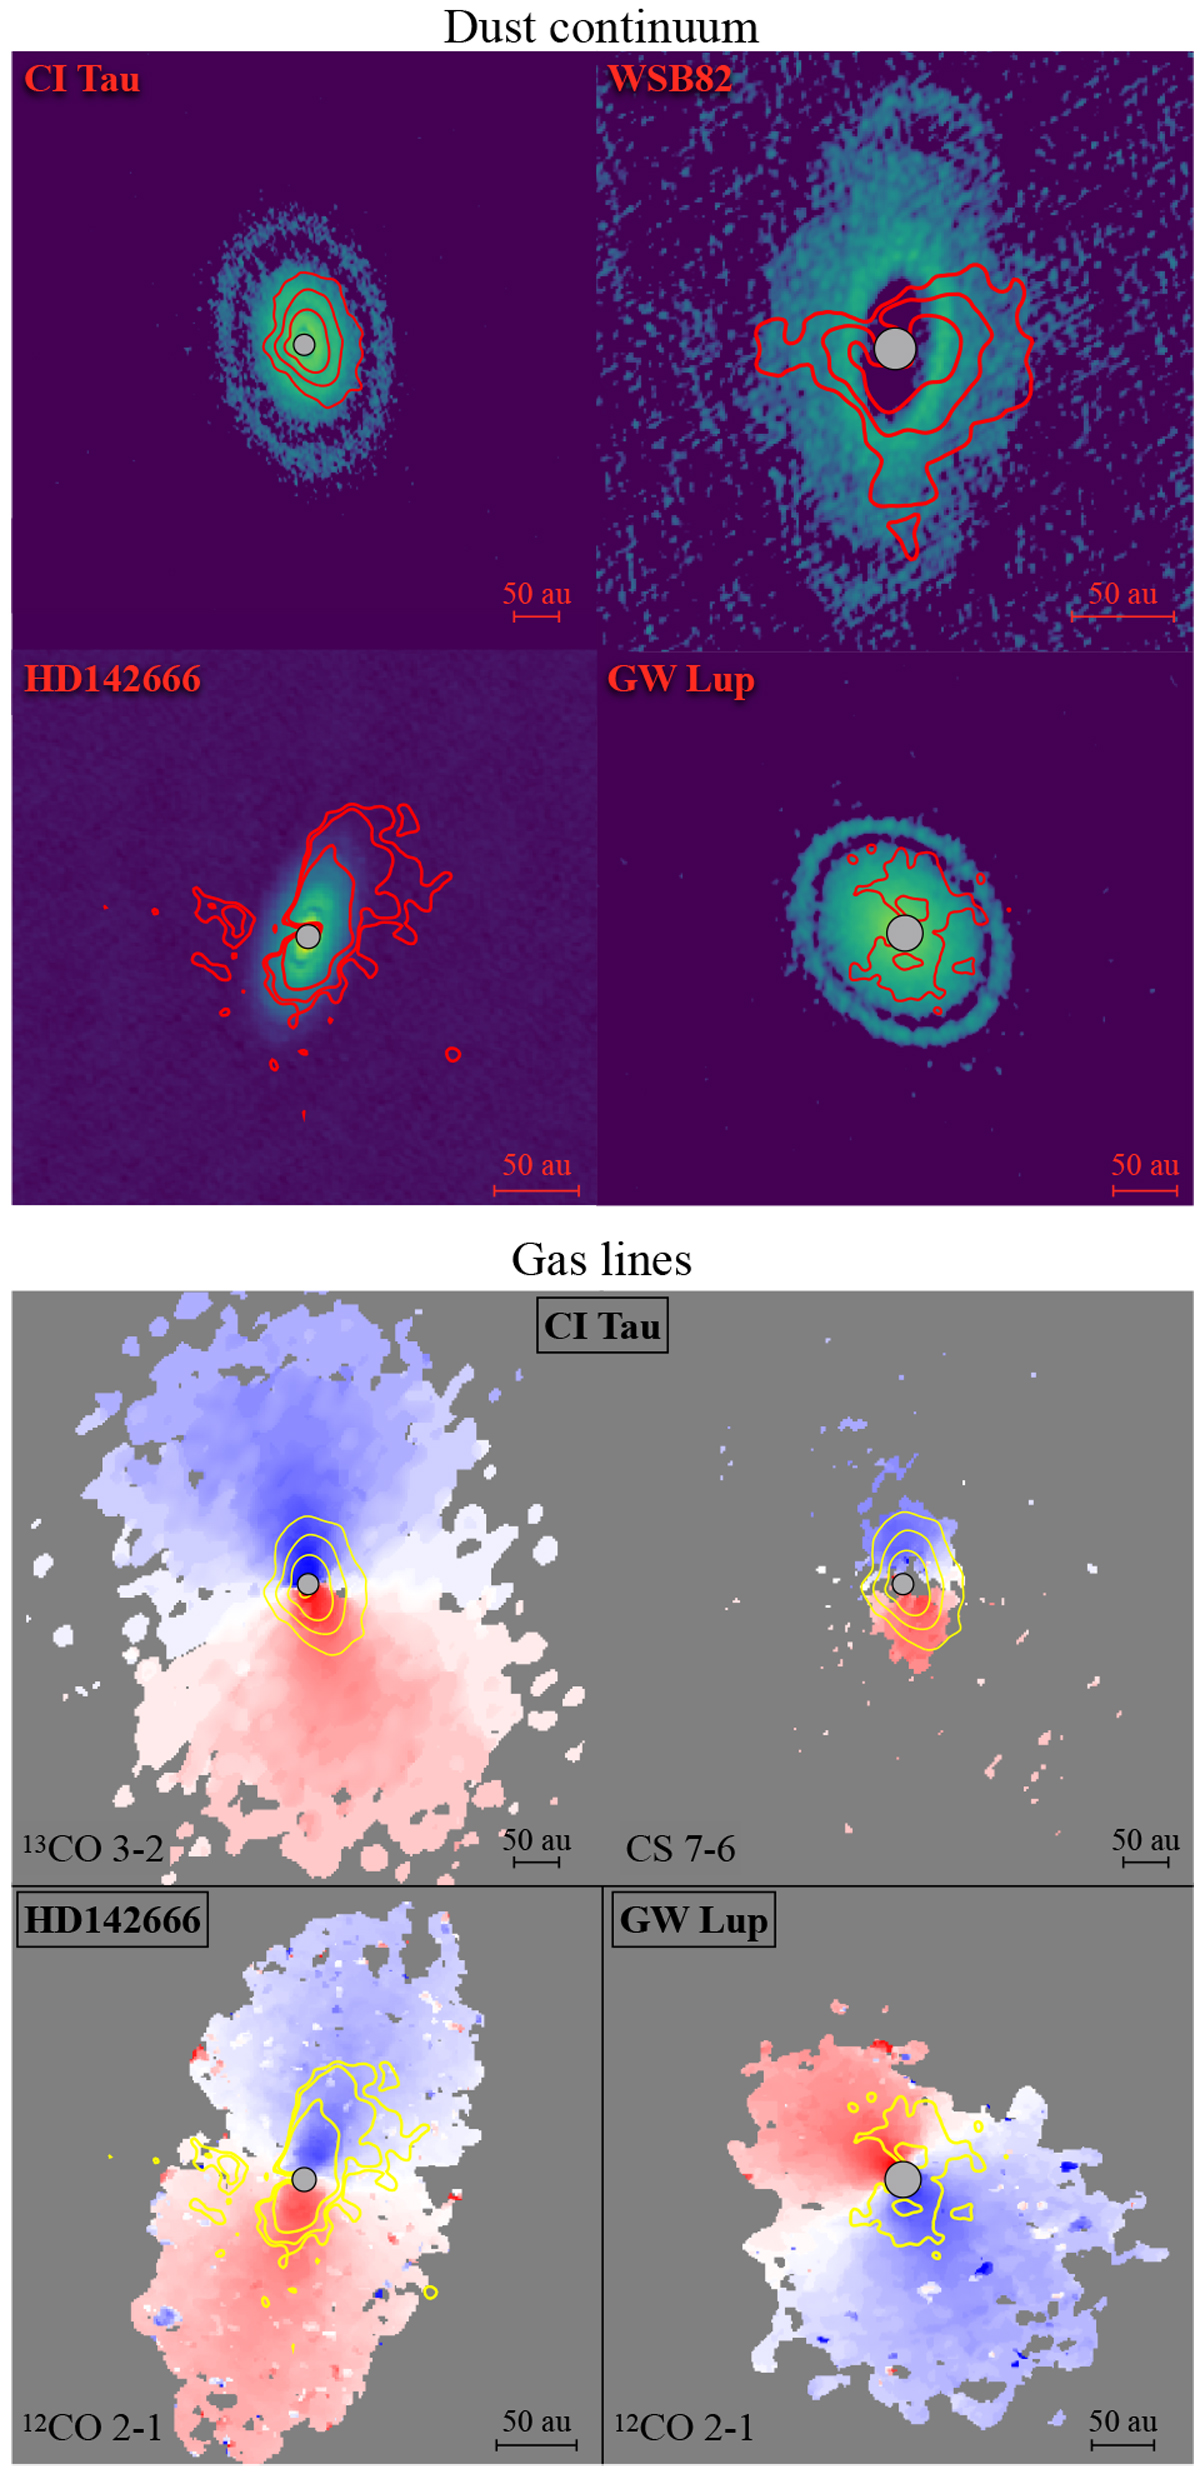
Comparison with ALMA high-resolution images. The continuum maps at 1.3 mm are shown and the top, and the intensity-weighted mean velocity (moment 1) maps clipped at 3σ of varied gas lines are at the bottom. The σ level is determined from a region as large as a resolution element devoid of signal in the channel maps. In each panel, the SPHERE detection at 3σ, 9σ, and 27σ significanceis shown with contours. The CI Tau continuum image is from Clarke et al. (2018), while the 13CO and CS images are from Rosotti et al. (2021). The continuum and the 12CO maps of GW Lup and HD 142666 are from the DSHARP program (Andrews et al. 2018). The continuum image of WSB82 is from the ODISEA program (Cieza et al. 2021). Images from the same target are shown with the same spatial scale. The inner gray region indicates the SPHERE coronagraph. North is up and east is left.
Current usage metrics show cumulative count of Article Views (full-text article views including HTML views, PDF and ePub downloads, according to the available data) and Abstracts Views on Vision4Press platform.
Data correspond to usage on the plateform after 2015. The current usage metrics is available 48-96 hours after online publication and is updated daily on week days.
Initial download of the metrics may take a while.