Fig. 1
Download original image
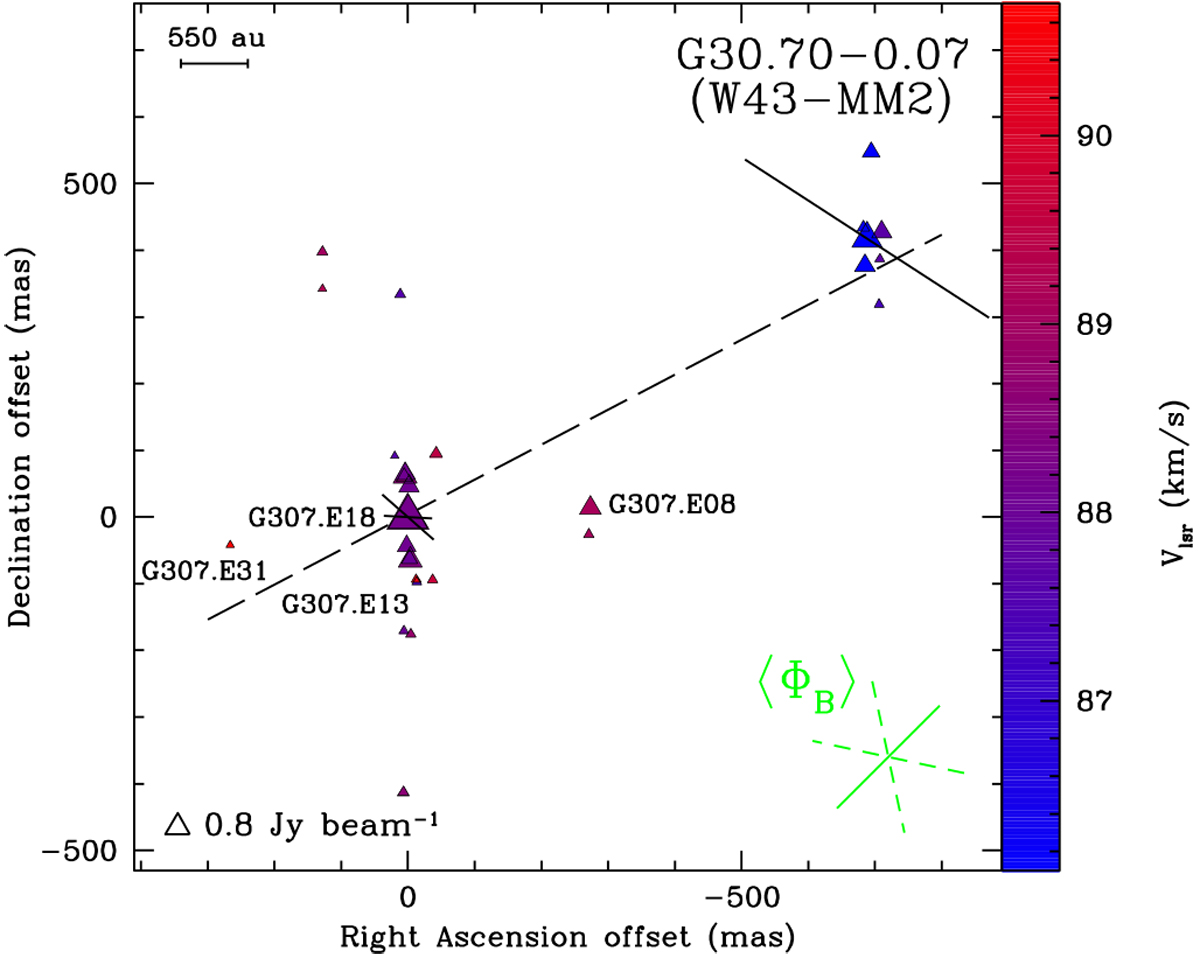
View of the CH3OH maser features detected around G30.70-0.07 (W43-MM2). The reference position is the estimated absolute position from Table 1. Triangles identify CH3OH maser features whose side length is scaled logarithmically according to their peak flux densities (Table A.1). Maser local standard of rest radial velocities are indicated by color (the assumed velocity of the region is
![]() km s−1; Nguyen-Lu’o’ng et al. 2013). The 0.8 Jy beam−1 symbol is plotted for comparison. The linear polarization vectors, scaled logarithmically according to the polarization fraction Pl (Pl = 0.07–1.2%; see Table A.1), are overplotted. In the bottom right corner, the corresponding error-weighted orientation of the magnetic field (⟨ΦB⟩, see Sect.5.1) is also shown. The two dashed segments indicate the uncertainty. The dashed line is the best least-squares linear fit of the CH3OH maser features (
km s−1; Nguyen-Lu’o’ng et al. 2013). The 0.8 Jy beam−1 symbol is plotted for comparison. The linear polarization vectors, scaled logarithmically according to the polarization fraction Pl (Pl = 0.07–1.2%; see Table A.1), are overplotted. In the bottom right corner, the corresponding error-weighted orientation of the magnetic field (⟨ΦB⟩, see Sect.5.1) is also shown. The two dashed segments indicate the uncertainty. The dashed line is the best least-squares linear fit of the CH3OH maser features (![]() °).
°).
Current usage metrics show cumulative count of Article Views (full-text article views including HTML views, PDF and ePub downloads, according to the available data) and Abstracts Views on Vision4Press platform.
Data correspond to usage on the plateform after 2015. The current usage metrics is available 48-96 hours after online publication and is updated daily on week days.
Initial download of the metrics may take a while.