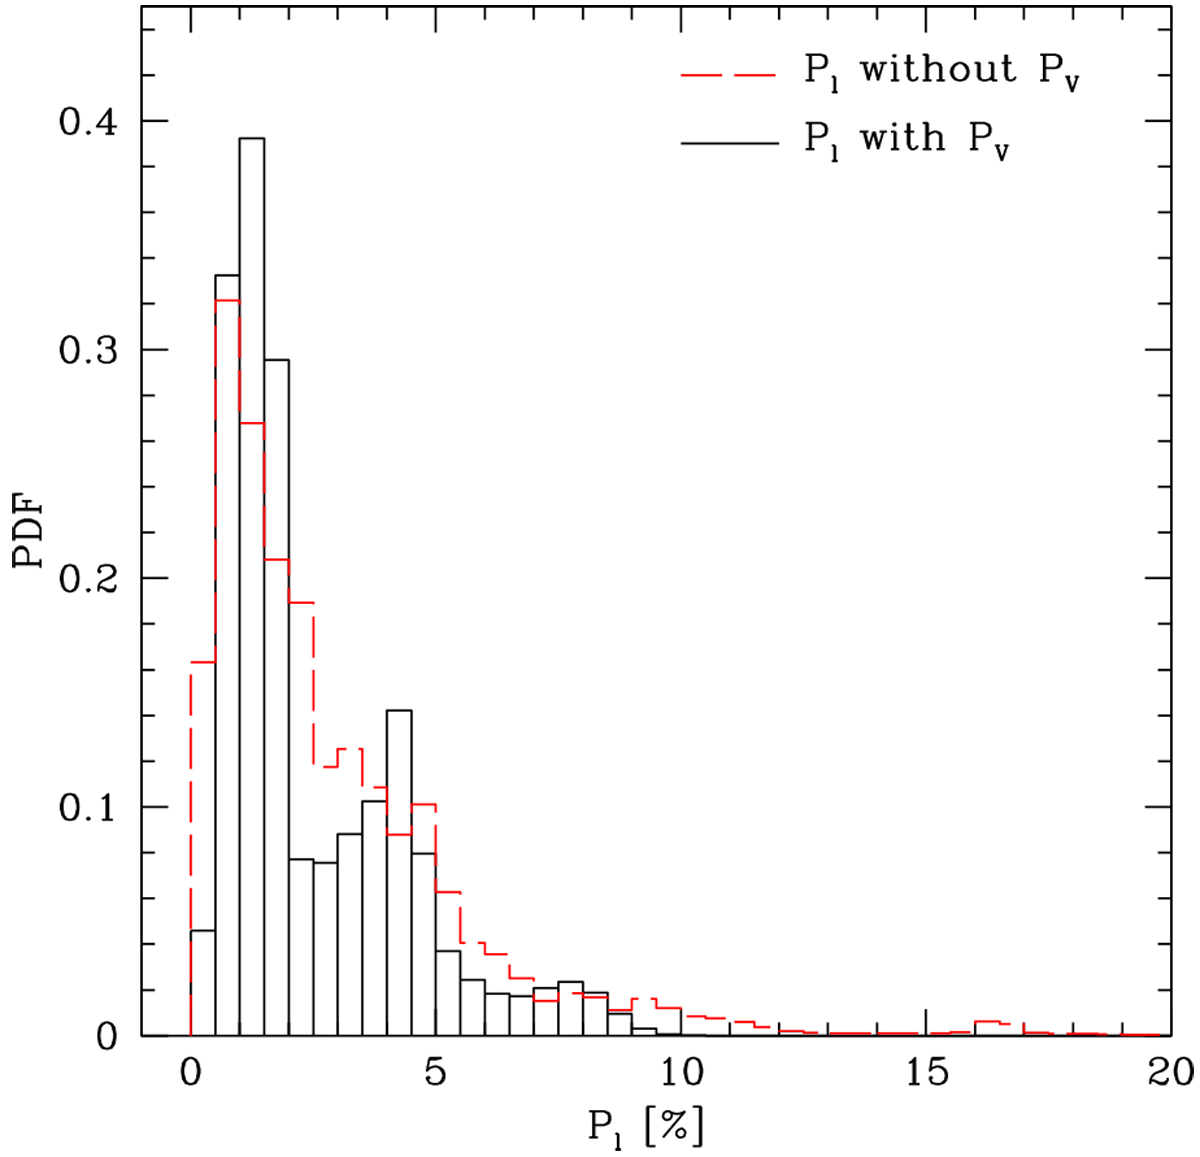
Fig. 12
Download original image
Probability distribution function of the linear polarization fraction (Pl) measured toward the 6.7 GHz CH3OH maser features of the flux-limited sample that do not show (dashed red histogram; distribution d1) and show (solid black histogram; distribution d2) circular polarized emission. The interval width of the histograms is 0.5%. The data are taken from Surcis et al. (2009, 2011a, 2014b), Vlemmings et al. (2010), Papers I–IV, and this work.
Current usage metrics show cumulative count of Article Views (full-text article views including HTML views, PDF and ePub downloads, according to the available data) and Abstracts Views on Vision4Press platform.
Data correspond to usage on the plateform after 2015. The current usage metrics is available 48-96 hours after online publication and is updated daily on week days.
Initial download of the metrics may take a while.