Fig. 7
Download original image
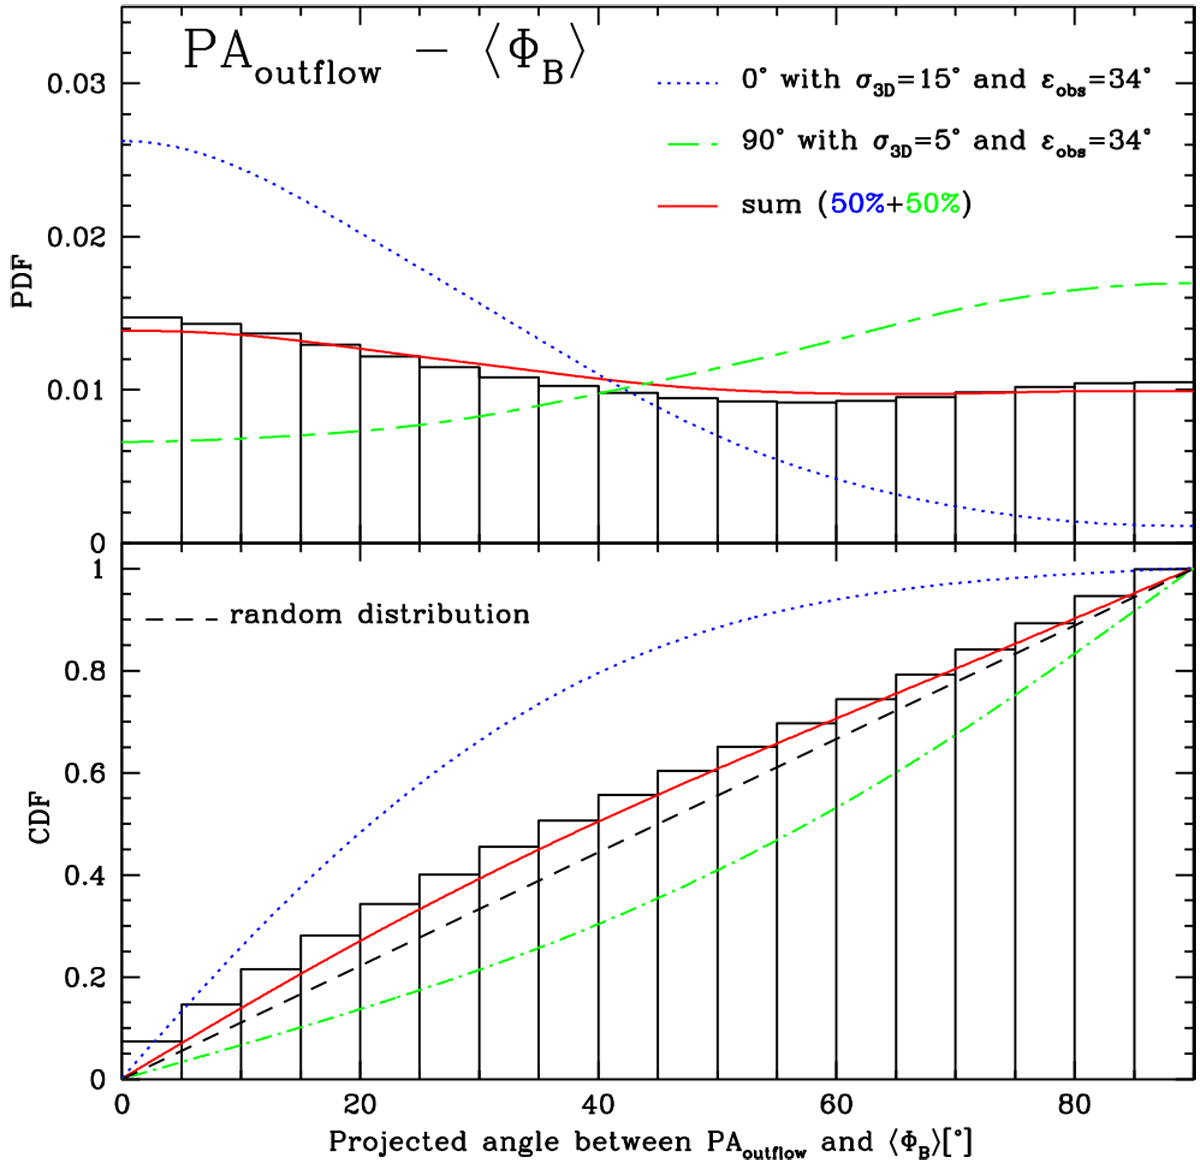
Probability distribution function (top panel) and the cumulative distribution function (bottom panel) of the projected angle between the magnetic field and the outflow axes (|PAoutflow −⟨ΦB⟩|). The dotted blue line is the result of a Monte Carlo simulation of the projection on the plane of the sky of two random 3D parallel vectors with a Gaussian uncertainty of 15° and with a projected Gaussian error of 34° (called 0 deg distribution). The dot-dashed green line is the result of a Monte Carlo simulation of the projection on the plane of the sky of two random 3D perpendicular vectors with a Gaussian uncertainty of 5° and with a projected error of 34° (called 90 deg distribution). The red line is the best combination of the previous two simulations to fit the observed data. Here, both the 0 deg distribution and the 90 deg distribution contribute to the 50%. The dashed black line is the CDF for a completely random orientation of outflows and magnetic fields, i.e., all angular differences are equally likely. The results of the K–S test are listed in Table 3.
Current usage metrics show cumulative count of Article Views (full-text article views including HTML views, PDF and ePub downloads, according to the available data) and Abstracts Views on Vision4Press platform.
Data correspond to usage on the plateform after 2015. The current usage metrics is available 48-96 hours after online publication and is updated daily on week days.
Initial download of the metrics may take a while.