Fig. 9
Download original image
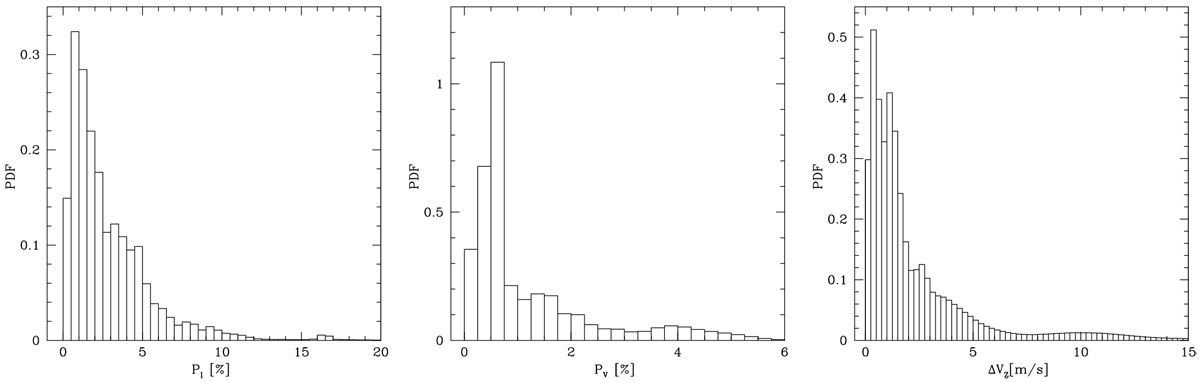
Probability density funtion of the linear polarization fraction (Pl, left panel), of the circular polarization fraction (PV, middle panel), and of the Zeeman-splitting (ΔVZ, right panel) of the 6.7 GHz CH3OH maser emission. The interval width of the histograms is 0.5% and 0.25% and 0.25 m s−1 for the Pl, PV, and the ΔVZ plots, respectively. The data are taken from: Surcis et al. (2009, 2011a, 2014b), Vlemmings et al. (2010), Papers I–IV, and this work.
Current usage metrics show cumulative count of Article Views (full-text article views including HTML views, PDF and ePub downloads, according to the available data) and Abstracts Views on Vision4Press platform.
Data correspond to usage on the plateform after 2015. The current usage metrics is available 48-96 hours after online publication and is updated daily on week days.
Initial download of the metrics may take a while.