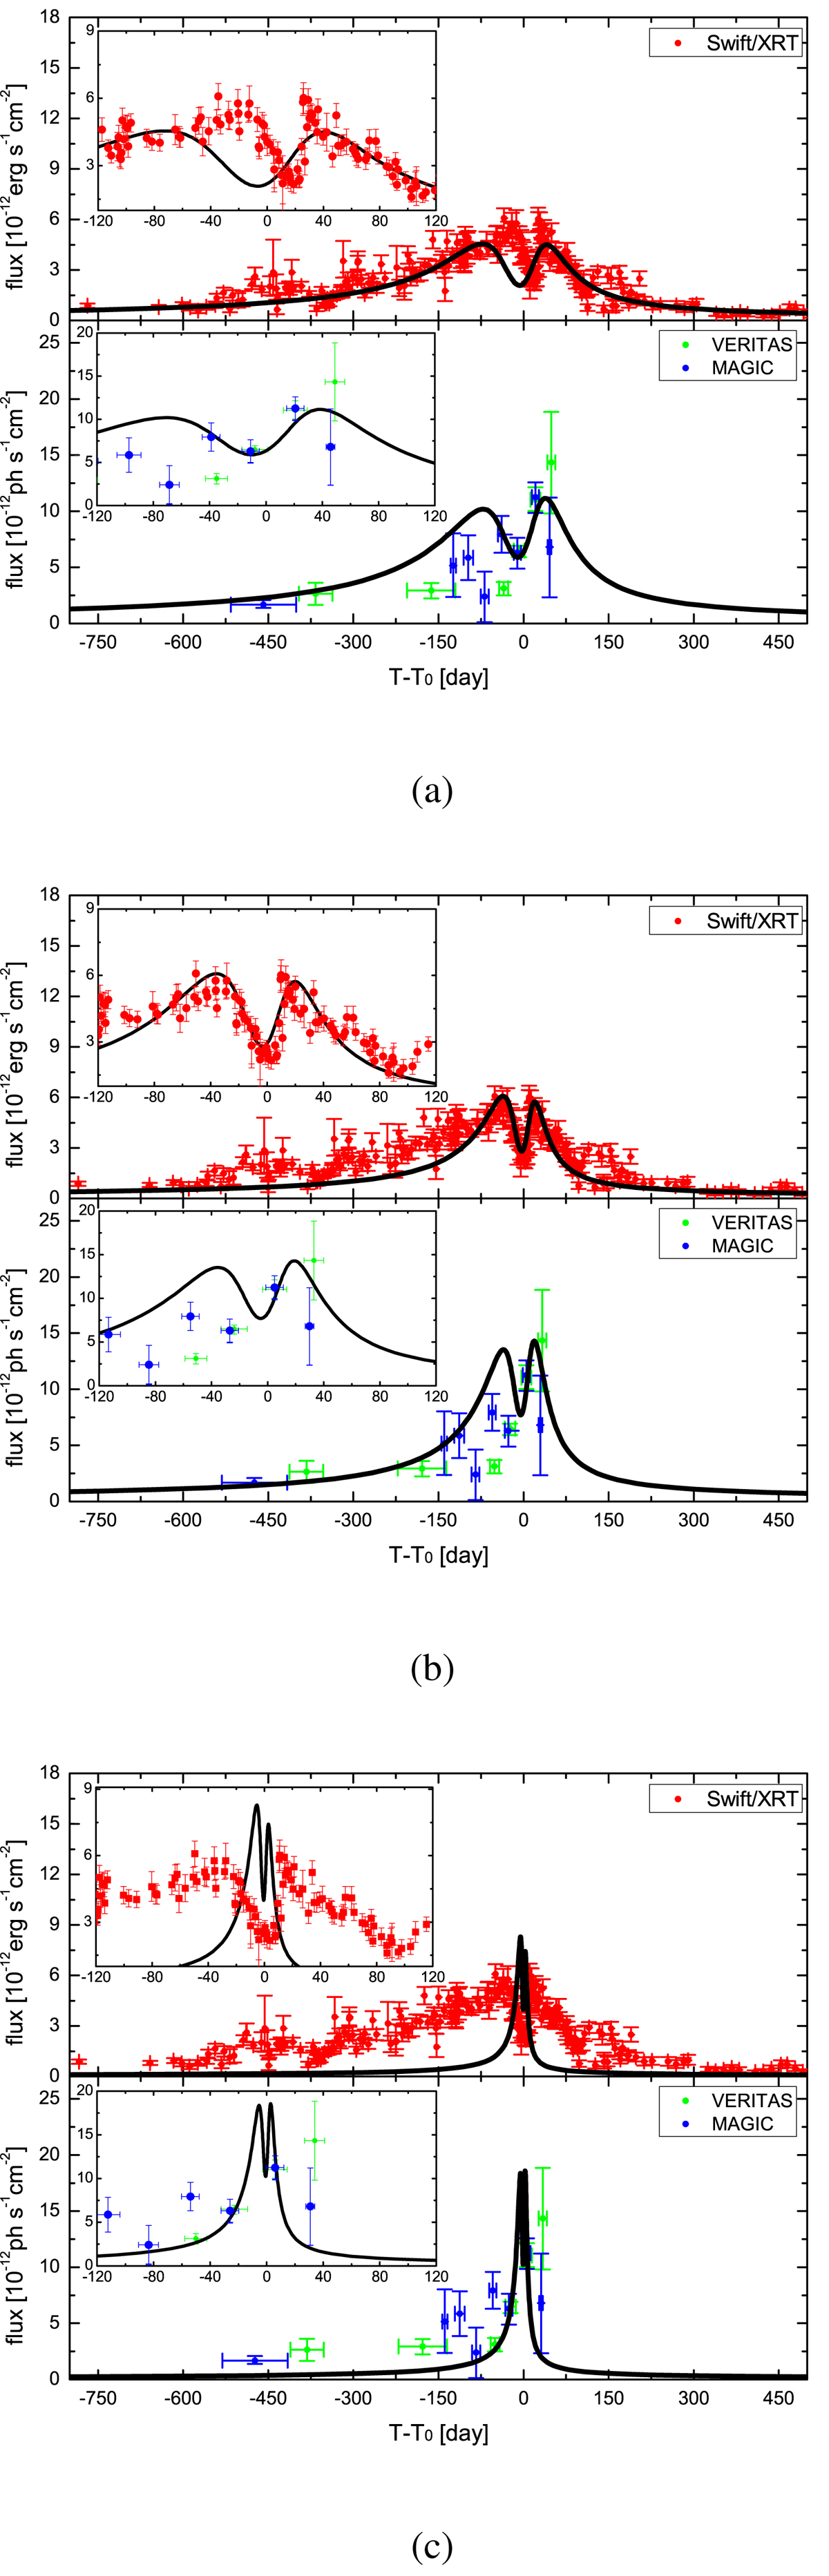
Fig. 6.
Download original image
Calculated X-ray and γ-ray light curves of PSR J2032+4127/MT91 213 under three different orbital solutions of Ho et al. (2017). The X-ray data are analysed in this work, while the γ-ray data are taken from Abeysekara et al. (2018). The inserted plots display the light curves from between T0 − 120 d to T0 + 120 d. (a) Model 1. (b) Model 2. (c) Model 3.
Current usage metrics show cumulative count of Article Views (full-text article views including HTML views, PDF and ePub downloads, according to the available data) and Abstracts Views on Vision4Press platform.
Data correspond to usage on the plateform after 2015. The current usage metrics is available 48-96 hours after online publication and is updated daily on week days.
Initial download of the metrics may take a while.