Free Access
Fig. 15
Download original image
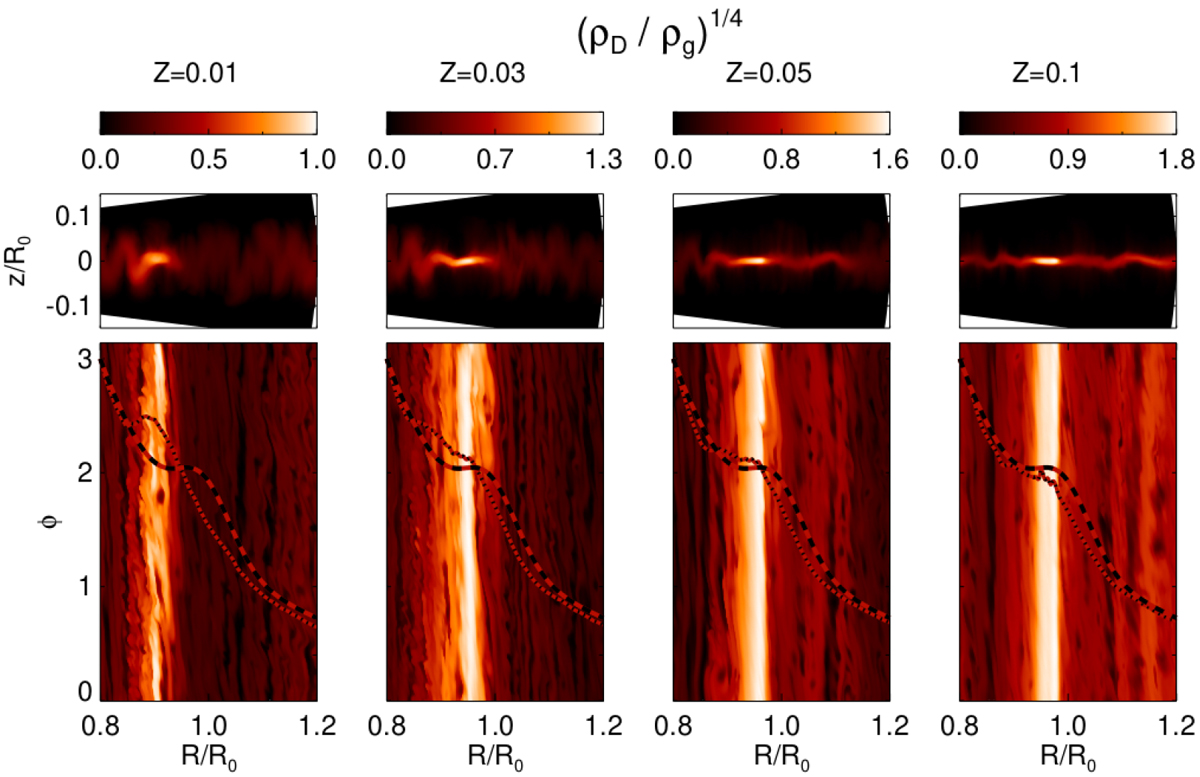
Snap shots of dust-to-gas density ratio at late times (800–1000 orbits) in simulations including a pressure bump with amplitude A = 0.4 and with Stokes number τ0 = 10−2. The dashed and dotted curves represent the initial and final mid-plane gas pressure profiles, respectively.
Current usage metrics show cumulative count of Article Views (full-text article views including HTML views, PDF and ePub downloads, according to the available data) and Abstracts Views on Vision4Press platform.
Data correspond to usage on the plateform after 2015. The current usage metrics is available 48-96 hours after online publication and is updated daily on week days.
Initial download of the metrics may take a while.