Fig. 16
Download original image
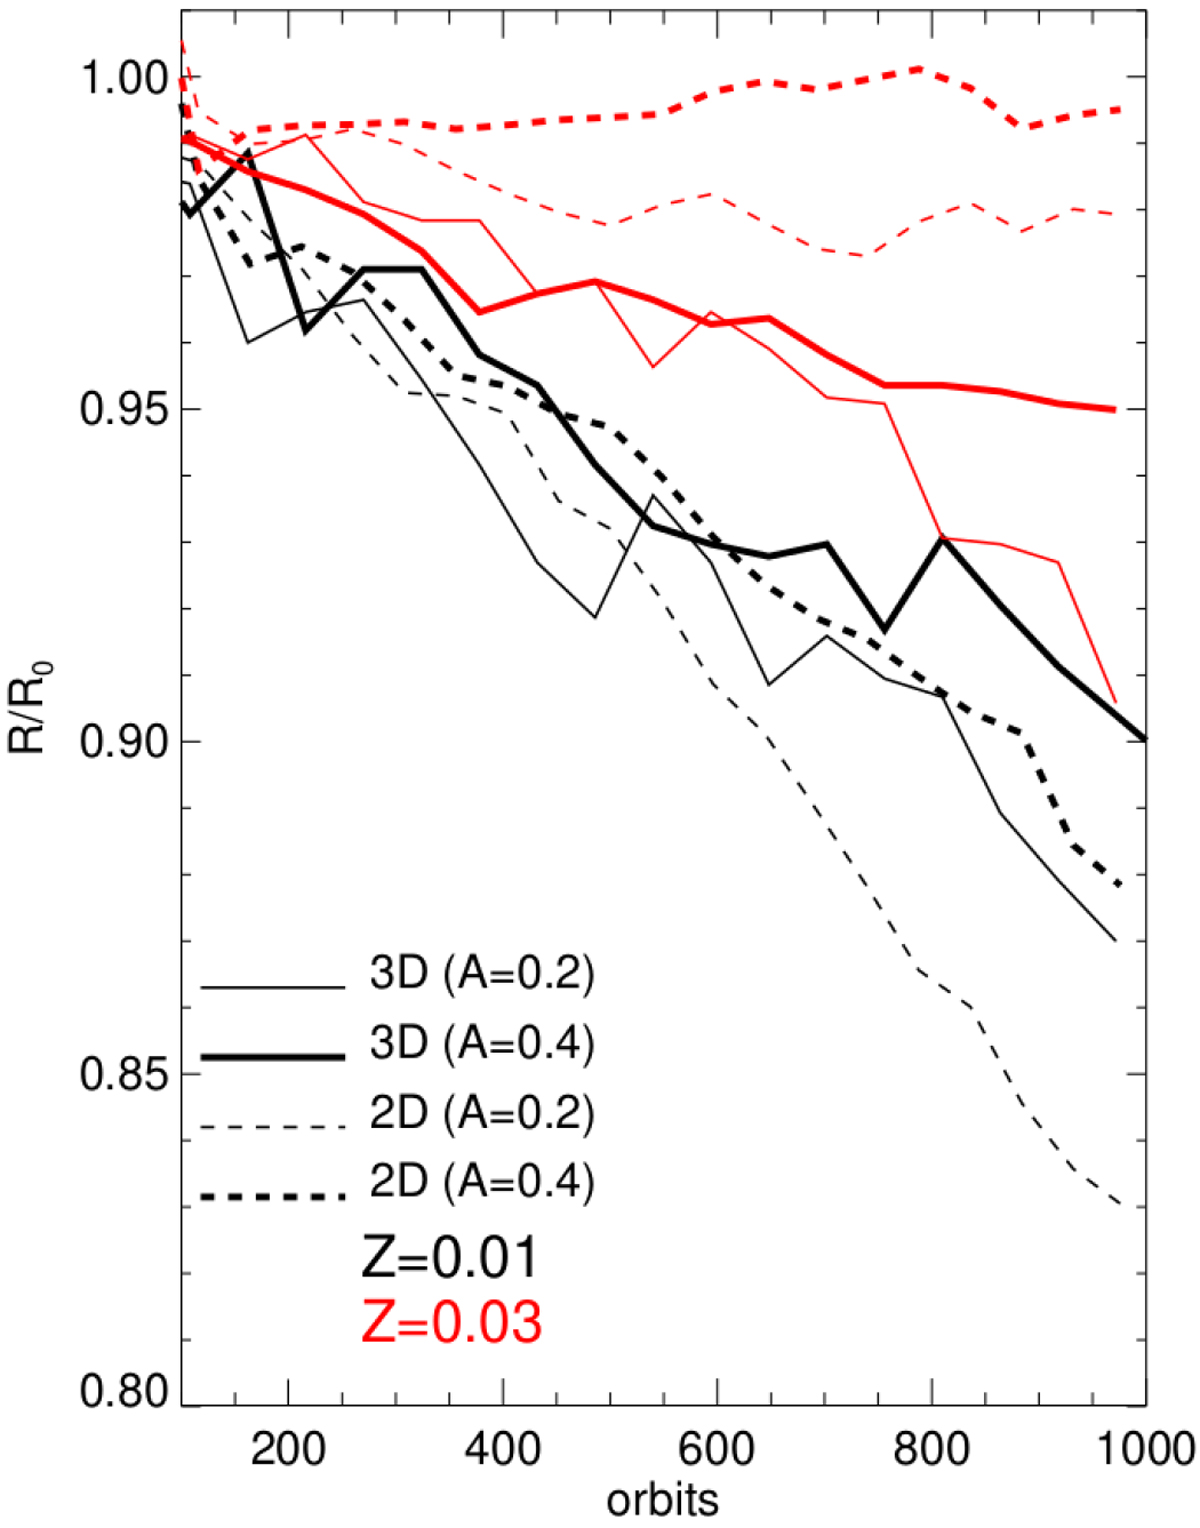
Radial locations of dust rings in 3D (solid curves) and 2D (dashed curves) simulations for metallicities Z = 0.01 (black curves), and Z = 0.03 (red curves) and bump amplitudes A = 0.2 (thin curves)and A = 0.4 (thick curves). The locations correspond to the maximum value of ϵ at each time. The sporadic reversals of the drift direction are due to turbulent fluctuations of the dust density within the rings. The 3D simulations are the same as in Figs. 13 and 15. The 2D simulations are those shownin Fig. 3.
Current usage metrics show cumulative count of Article Views (full-text article views including HTML views, PDF and ePub downloads, according to the available data) and Abstracts Views on Vision4Press platform.
Data correspond to usage on the plateform after 2015. The current usage metrics is available 48-96 hours after online publication and is updated daily on week days.
Initial download of the metrics may take a while.