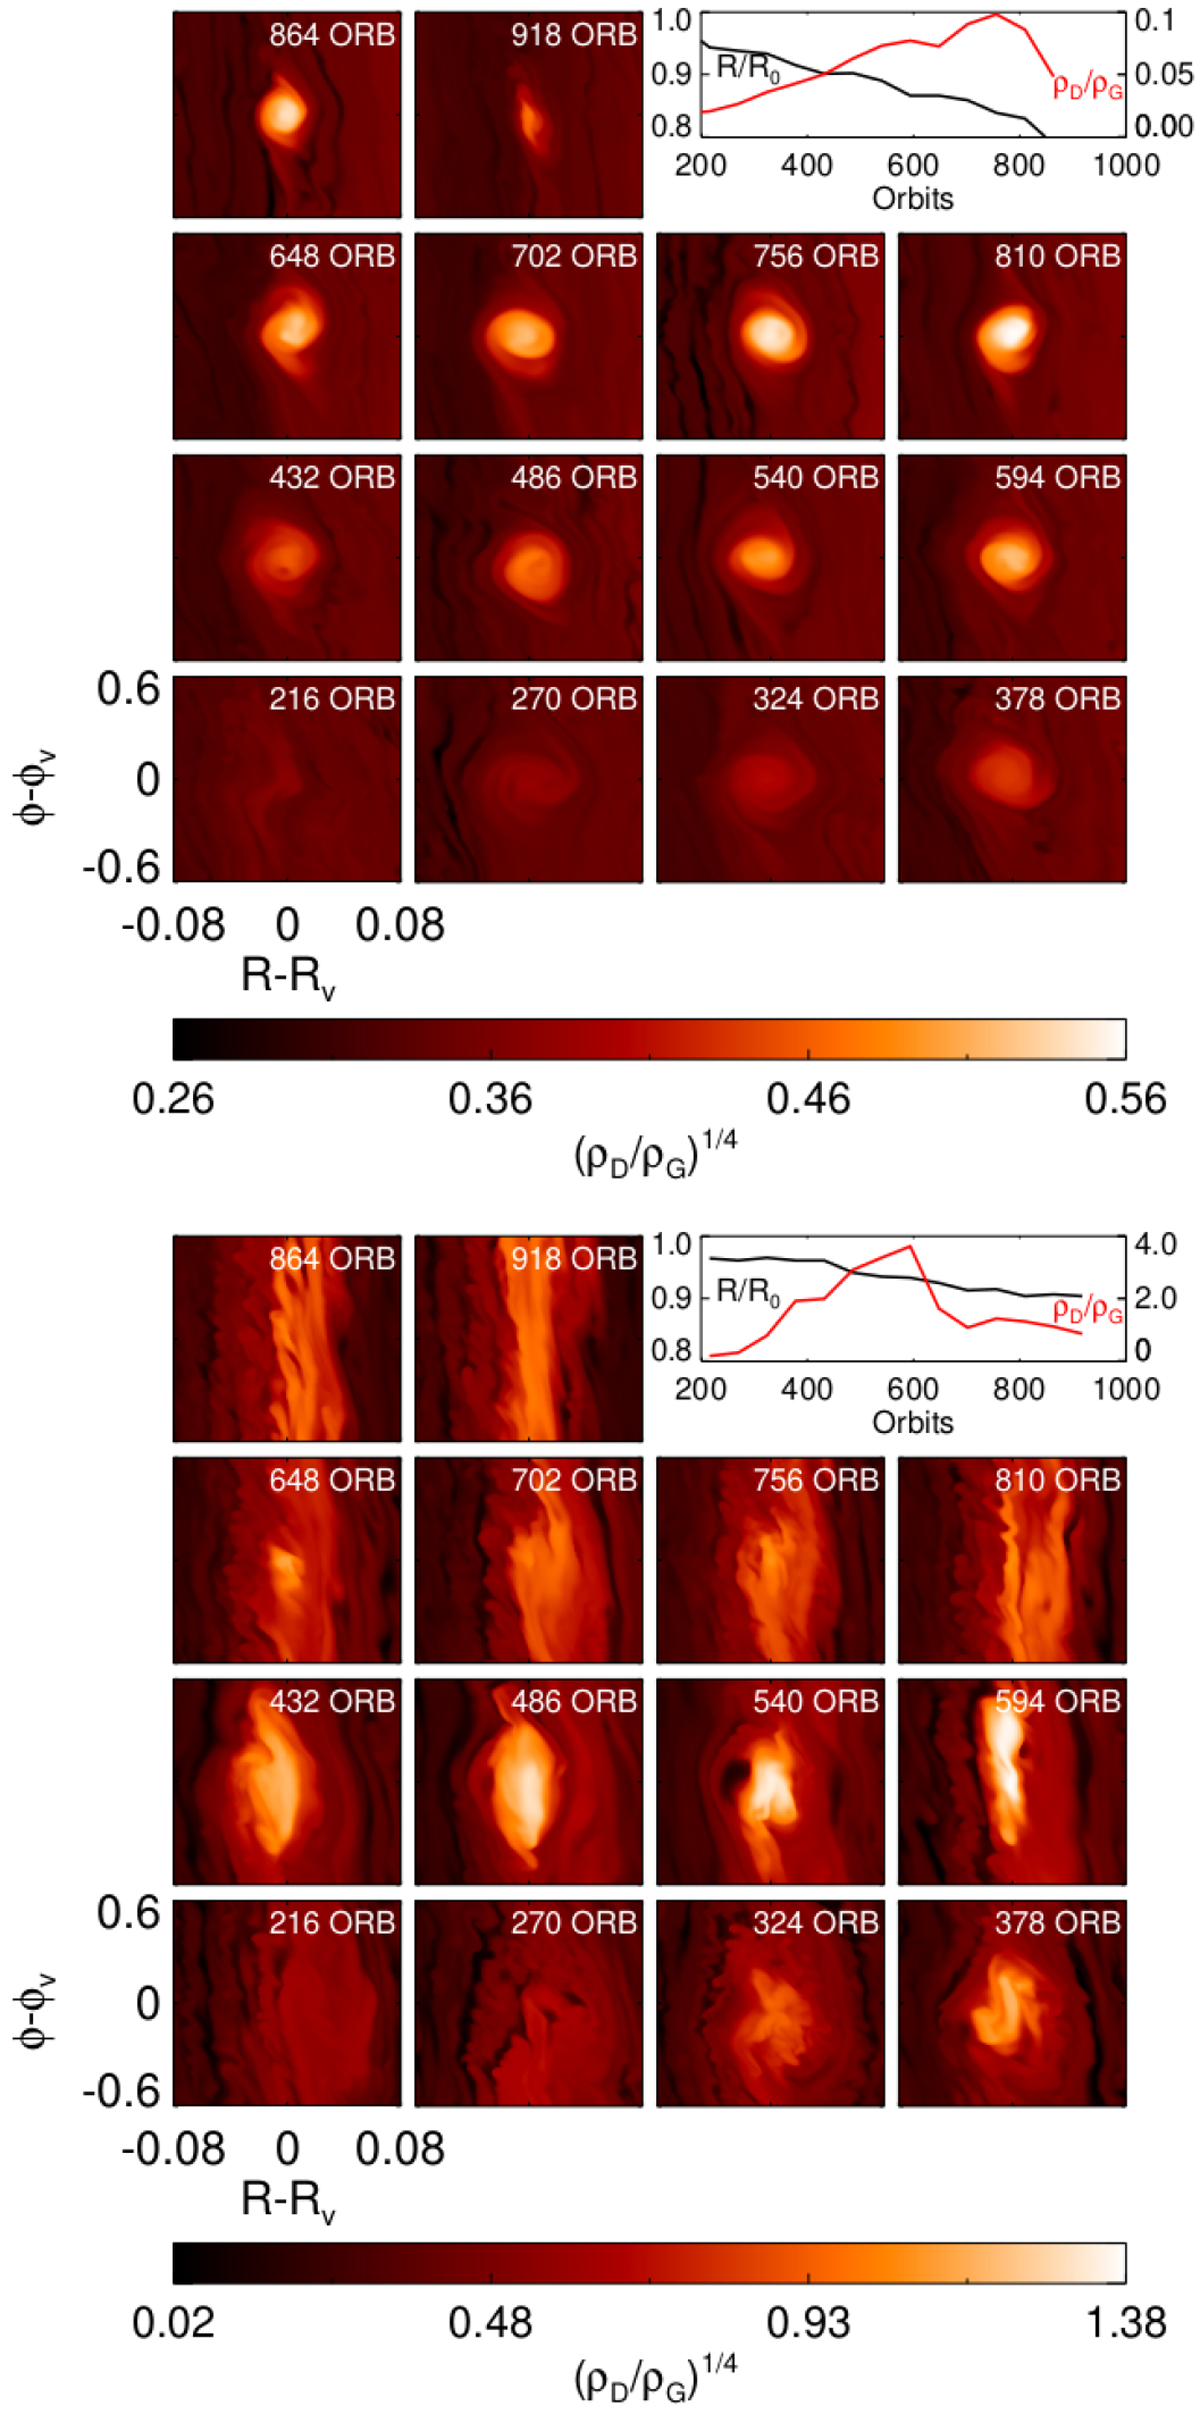
Fig. 22
Download original image
Example evolution of large dusty vortices that formed at a pressure bump (A = 0.4) in 3D simulations with metallicity Z = 0.01 and Stokes numbers τ0 = 10−3 (upper panels) and τ0 = 10−2 (lower panels). The contour plots show the dust-to-gas ratio. The insert plot displays the vortex location (black curve) and its maximum dust-to-gas ratio (red curve) as functions of time.
Current usage metrics show cumulative count of Article Views (full-text article views including HTML views, PDF and ePub downloads, according to the available data) and Abstracts Views on Vision4Press platform.
Data correspond to usage on the plateform after 2015. The current usage metrics is available 48-96 hours after online publication and is updated daily on week days.
Initial download of the metrics may take a while.