Fig. B.1
Download original image
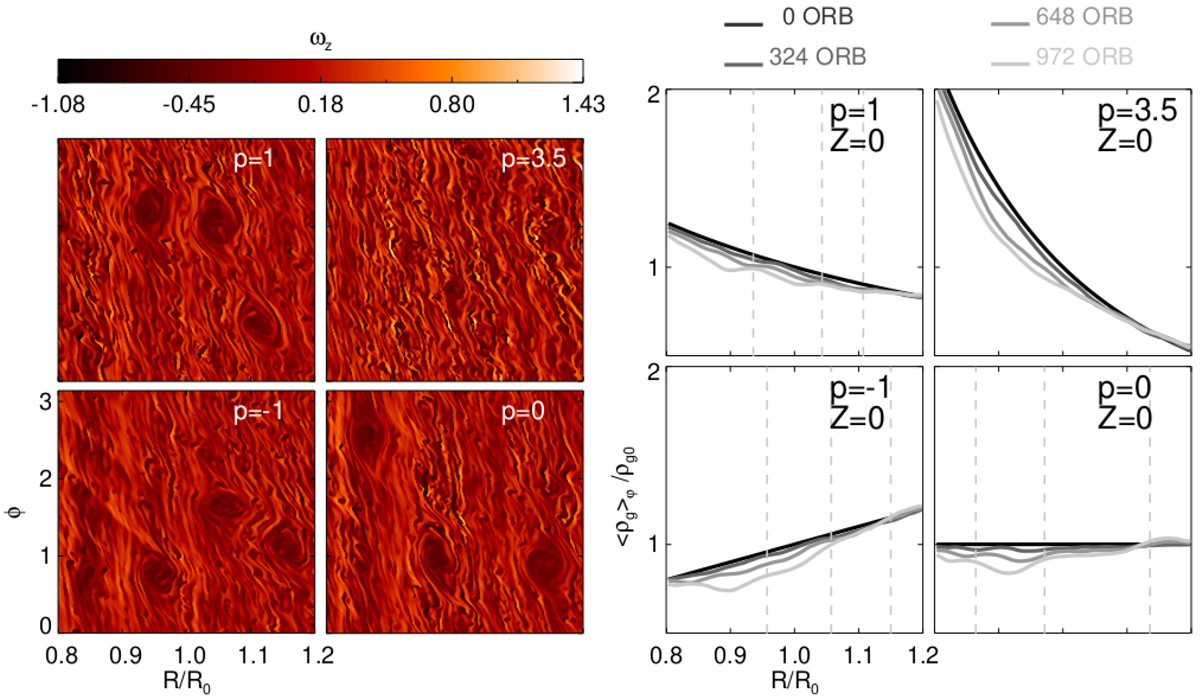
Comparison of vortex formation in dust-free simulations with varying gas density slope p through corresponding variation of the slope s of the surface mass density. Left: Mid-plane plots of the z-component of the gas vorticity (42) after ~ 1000 orbits. Right: Evolution of the mid-plane gas density. The dashed lines indicate the locations of three large vortices at ~ 1000 orbits.
Current usage metrics show cumulative count of Article Views (full-text article views including HTML views, PDF and ePub downloads, according to the available data) and Abstracts Views on Vision4Press platform.
Data correspond to usage on the plateform after 2015. The current usage metrics is available 48-96 hours after online publication and is updated daily on week days.
Initial download of the metrics may take a while.