Fig. 3
Download original image
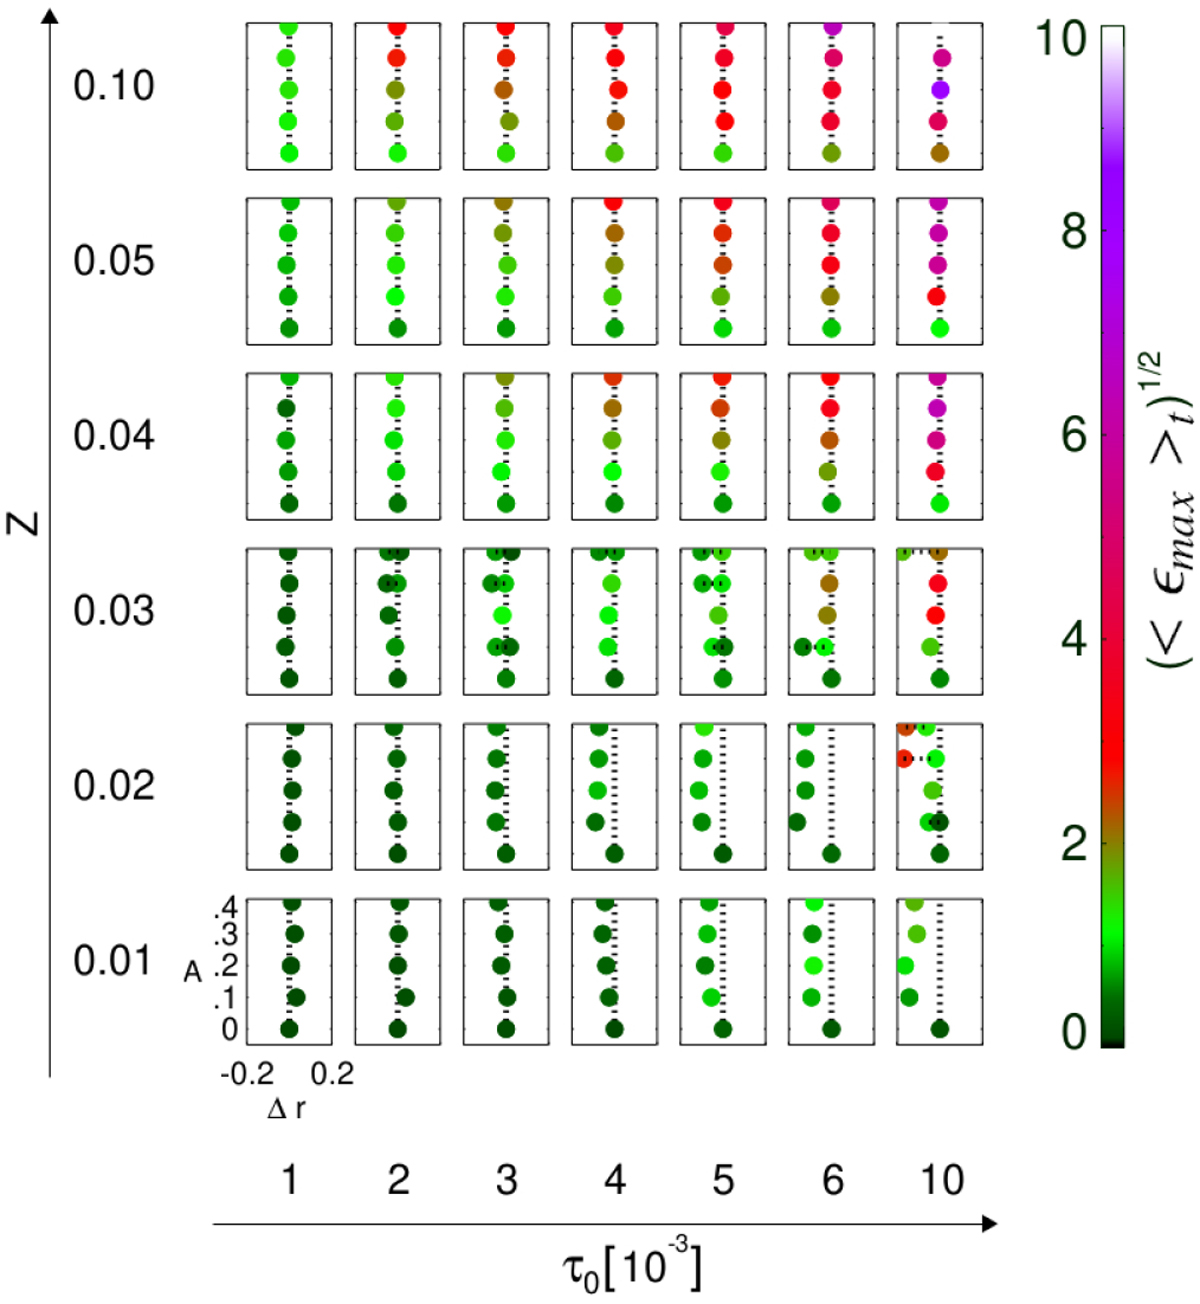
2D simulation survey of the effect of a pressure bump on dust evolution. Shown is the final location of
![]() within the domain 0.8 ≤ R ≤ 1.2 and its value is indicated through the coloring. The different panels along the vertical direction compare different metallicities, while those along the horizontal direction compare different Stokes numbers. Within each panel different amplitudes
A
are compared. In cases where two dots are shown, the original dust ring has produced a secondary ring through a dusty gas instability, as described in the text.
within the domain 0.8 ≤ R ≤ 1.2 and its value is indicated through the coloring. The different panels along the vertical direction compare different metallicities, while those along the horizontal direction compare different Stokes numbers. Within each panel different amplitudes
A
are compared. In cases where two dots are shown, the original dust ring has produced a secondary ring through a dusty gas instability, as described in the text.
Current usage metrics show cumulative count of Article Views (full-text article views including HTML views, PDF and ePub downloads, according to the available data) and Abstracts Views on Vision4Press platform.
Data correspond to usage on the plateform after 2015. The current usage metrics is available 48-96 hours after online publication and is updated daily on week days.
Initial download of the metrics may take a while.