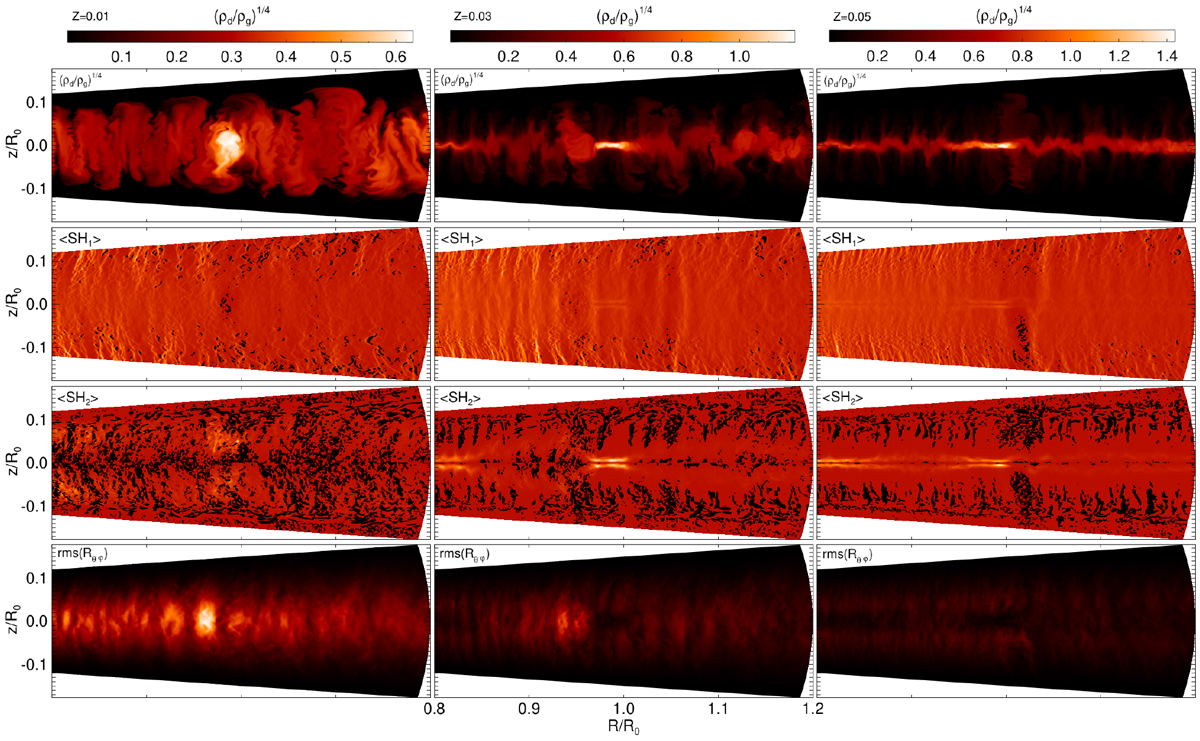
Fig. 5
Download original image
Meridional cuts of (from top to bottom) the dust-to-gas ratio at 450 orbits, the averaged Solberg–Høiland expressions (39), (40) (the left hand side terms) and root mean squared vertical Reynolds stress. Averages are taken over the time 350–450 orbits. In the panels ⟨SH1 ⟩ and ⟨SH2⟩, negative values are indicated by a black color. These plots compare the same simulations as in Fig. 4 and illustrate the emergence of a dusty gas instability through a violation of the Solberg–Høiland criteria.
Current usage metrics show cumulative count of Article Views (full-text article views including HTML views, PDF and ePub downloads, according to the available data) and Abstracts Views on Vision4Press platform.
Data correspond to usage on the plateform after 2015. The current usage metrics is available 48-96 hours after online publication and is updated daily on week days.
Initial download of the metrics may take a while.