Fig. 7
Download original image
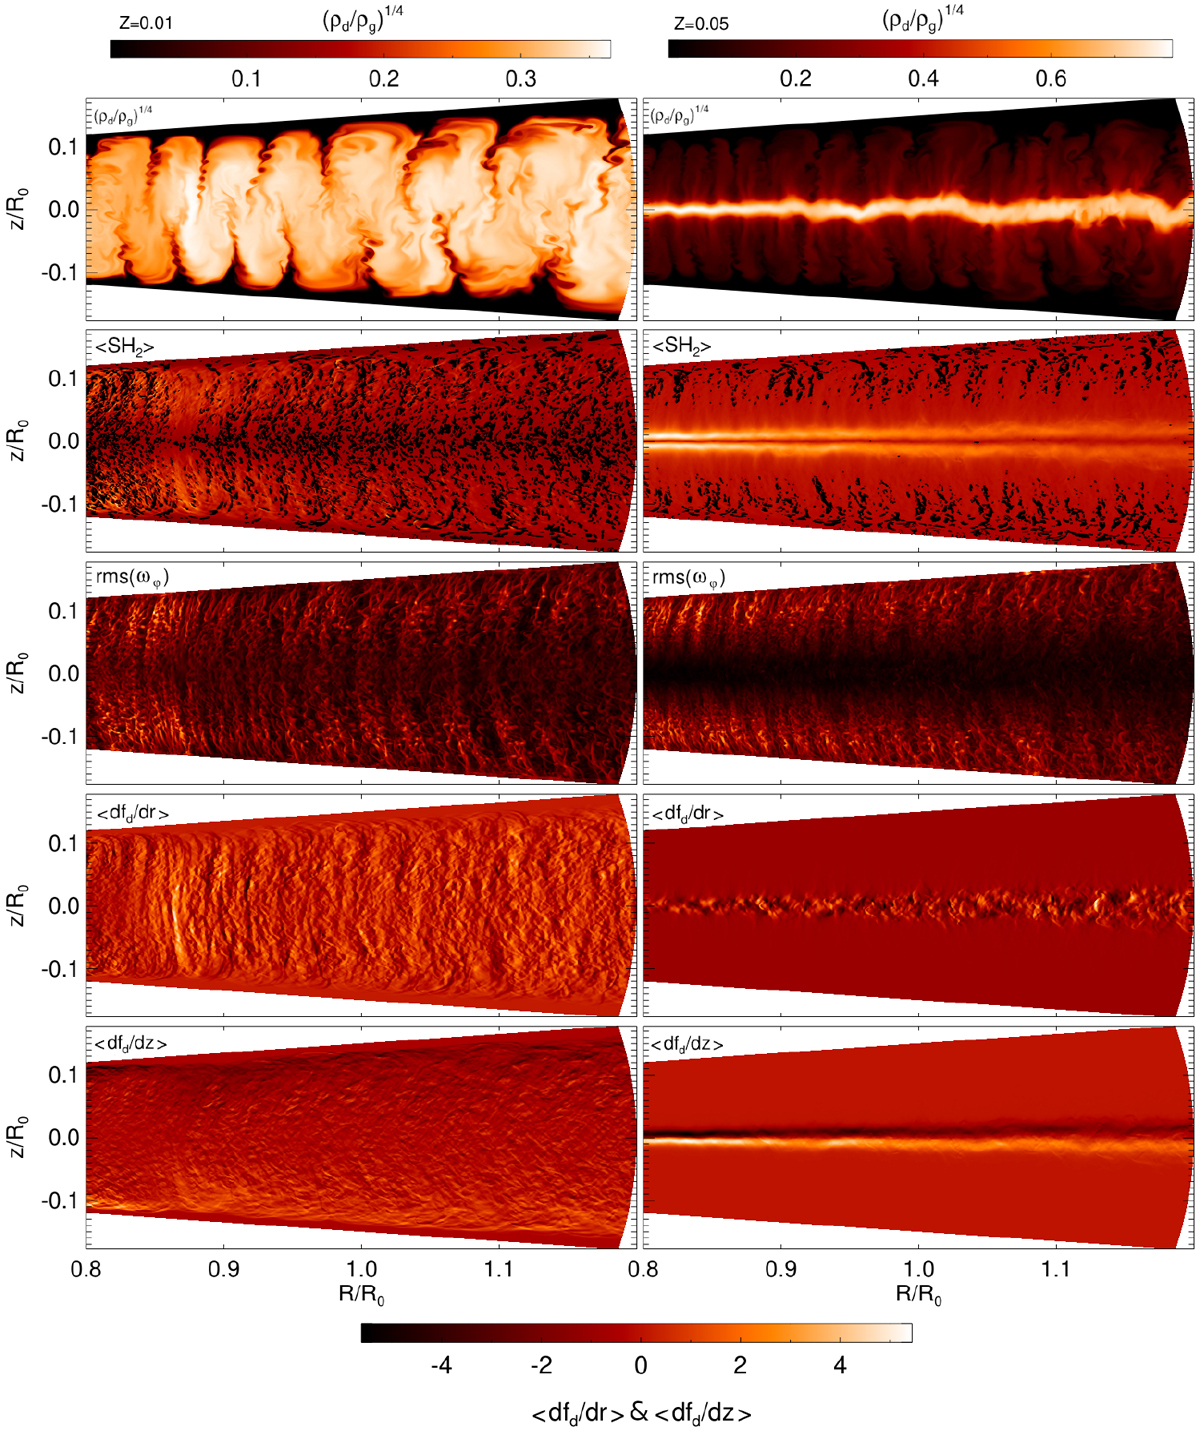
Illustration of the origin of the increased vertical Reynolds stress ![]() in 2D simulations with small Z and τ0 = 10−3 compared to the dust-free simulation as seen in Fig. 6. In the left panels, corresponding to Z = 0.01, the VSI strongly corrugates the dust-layer which results in non-vanishing radial and vertical gradients of fd which result in a violation of Eq. (40), which is indicated by black colors in the plots labeled ⟨SH2 ⟩. The largest contribution to the violation is by radial gradients. The right panels correspond to Z = 0.05 where the VSI is too much weakened to cause significant corrugation.
in 2D simulations with small Z and τ0 = 10−3 compared to the dust-free simulation as seen in Fig. 6. In the left panels, corresponding to Z = 0.01, the VSI strongly corrugates the dust-layer which results in non-vanishing radial and vertical gradients of fd which result in a violation of Eq. (40), which is indicated by black colors in the plots labeled ⟨SH2 ⟩. The largest contribution to the violation is by radial gradients. The right panels correspond to Z = 0.05 where the VSI is too much weakened to cause significant corrugation.
Current usage metrics show cumulative count of Article Views (full-text article views including HTML views, PDF and ePub downloads, according to the available data) and Abstracts Views on Vision4Press platform.
Data correspond to usage on the plateform after 2015. The current usage metrics is available 48-96 hours after online publication and is updated daily on week days.
Initial download of the metrics may take a while.