Fig. 12
Download original image
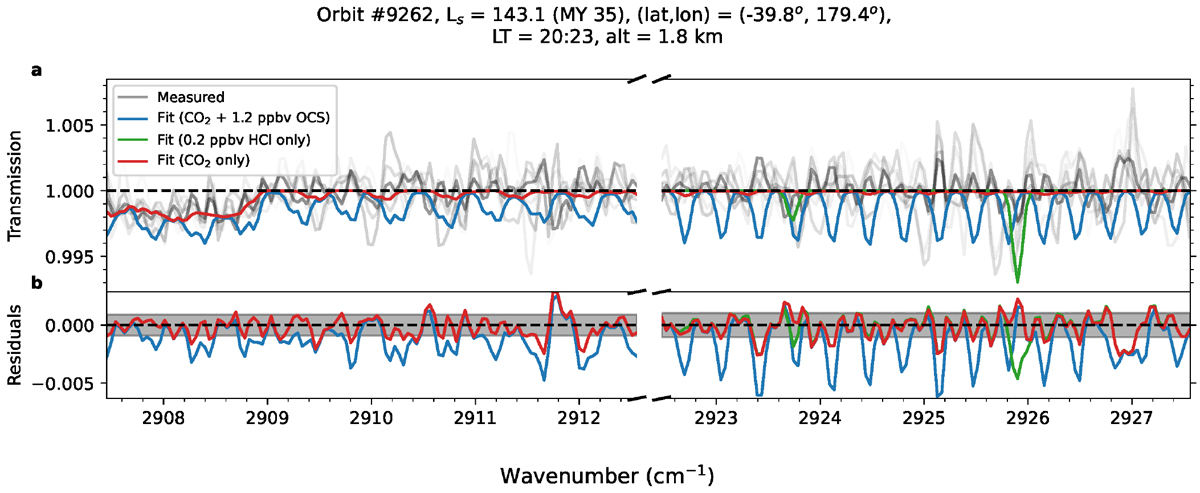
Upper limit of OCS from position 11 spectra. Panel a: fit to the spectrum with the lowest retrieved OCS upper limit in the position 11 dataset, with a 3σ value equivalent to 1.2 ppbv. As in Fig. 8, the grey lines represent each of the spectra on the detector array used to estimate the OCS detection limit, where the darker the grey colour, the higher the S/N. On the left we show the fit to the spectrum in diffraction order 173, and to the right we show the simultaneous fit to order 174. For reference, we also plot the approximate 3σ upper limit of HCl in green, equivalent to 0.2 ppbv, as well as the contribution of CO2 to the fit. Panel b: residuals of the spectral fit.
Current usage metrics show cumulative count of Article Views (full-text article views including HTML views, PDF and ePub downloads, according to the available data) and Abstracts Views on Vision4Press platform.
Data correspond to usage on the plateform after 2015. The current usage metrics is available 48-96 hours after online publication and is updated daily on week days.
Initial download of the metrics may take a while.