Fig. 1.
Download original image
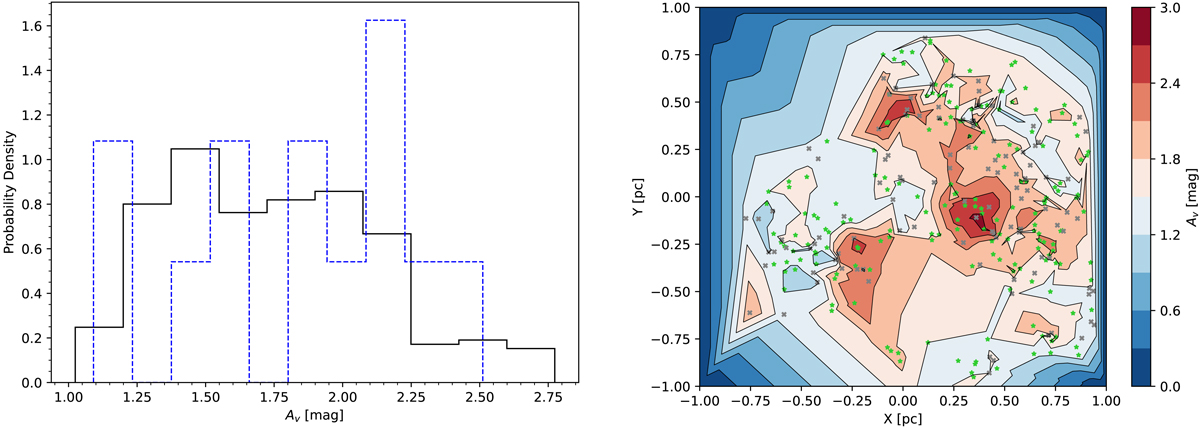
Distribution of variable extinction values generated for members of a cluster with no binaries as part of the Obs-B observations. Left panel: normalised histogram of Av values for OB members (blue dashed line) and all members (solid black line). Right panel: corresponding visual extinction map with star positions overlaid. Stars observed and not found by Gaia are shown as green stars and grey crosses, respectively.
Current usage metrics show cumulative count of Article Views (full-text article views including HTML views, PDF and ePub downloads, according to the available data) and Abstracts Views on Vision4Press platform.
Data correspond to usage on the plateform after 2015. The current usage metrics is available 48-96 hours after online publication and is updated daily on week days.
Initial download of the metrics may take a while.