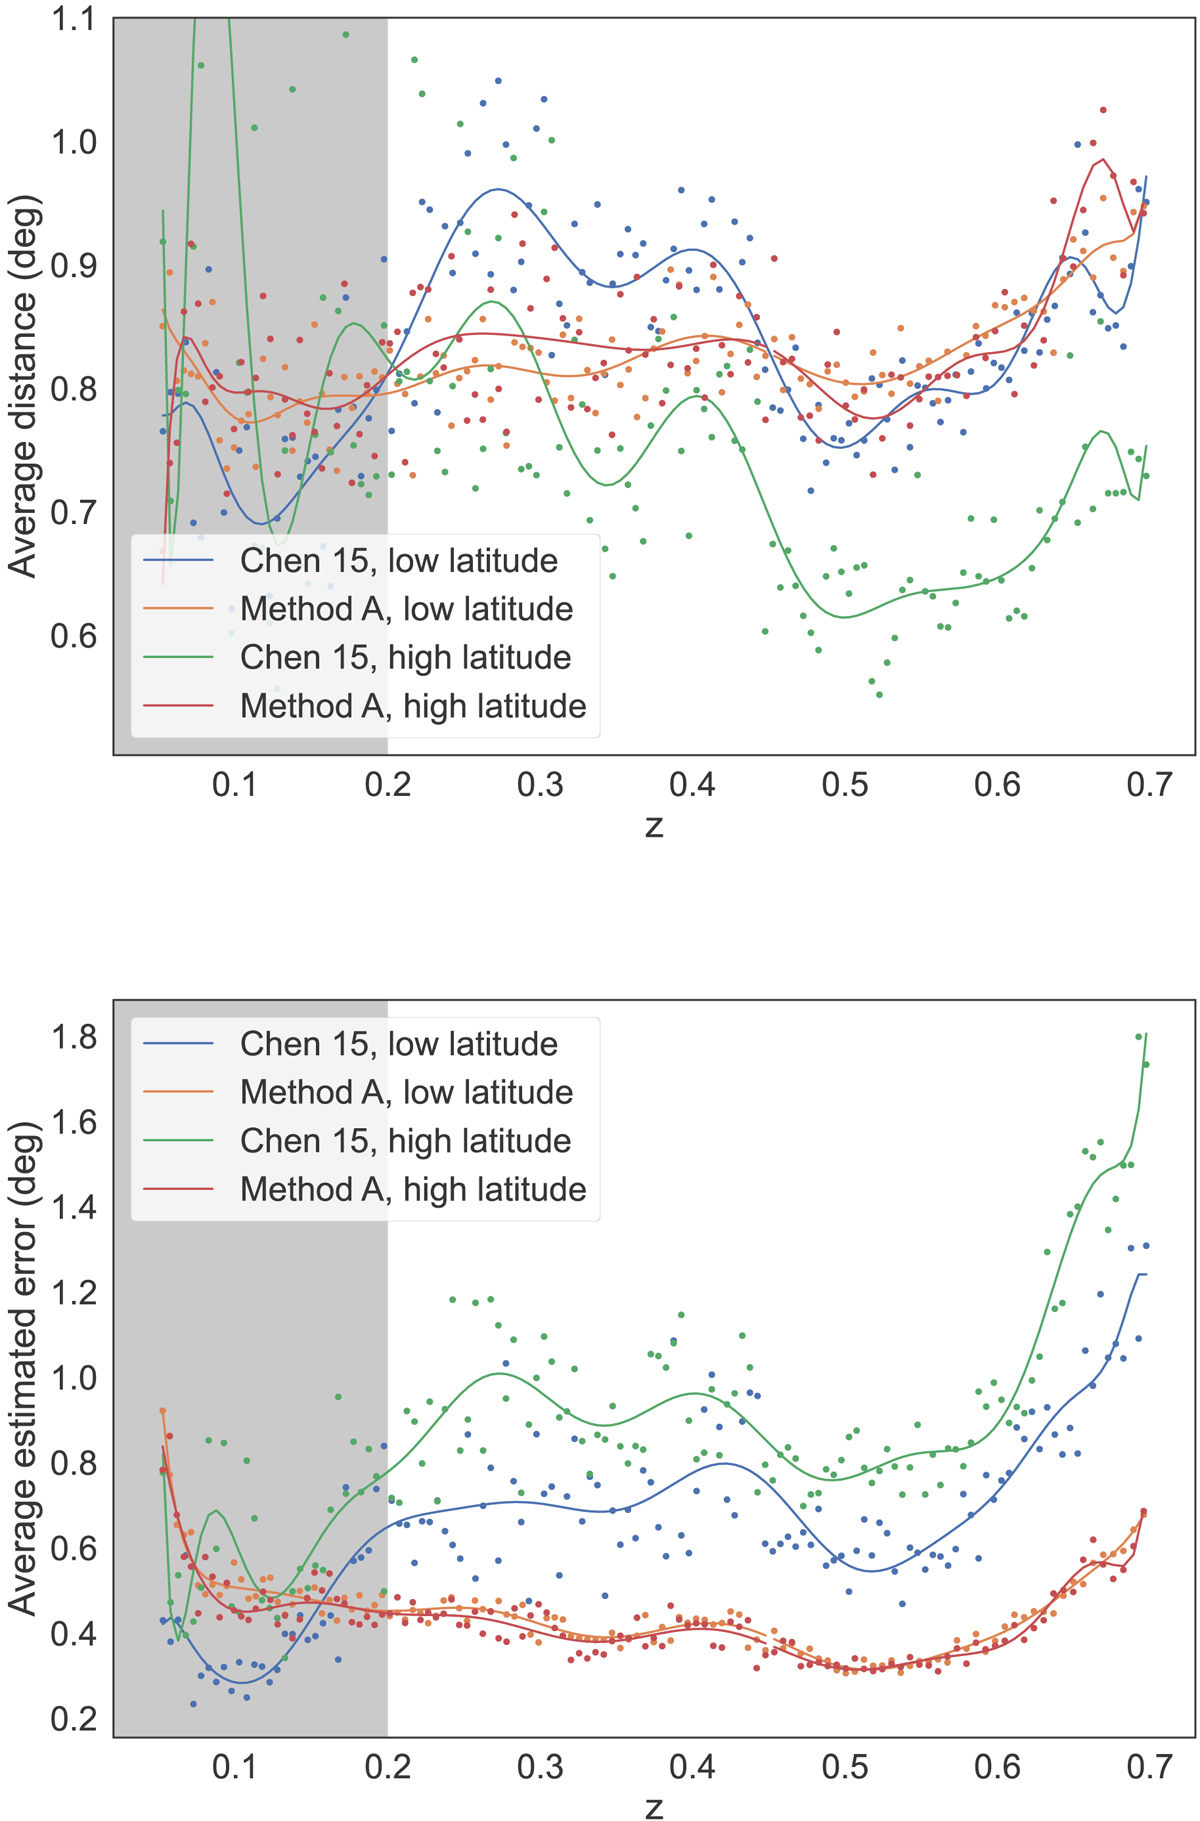
Fig. 14.
Download original image
Top: average distance from galaxies to their closest filaments, in degrees. Bottom: average estimated uncertainty on the location of the centre of the filaments, in degrees. Both metrics are calculated separately for high- and low-latitude filaments. For z < 0.2 (grey band), filaments are reconstructed from different data in the two catalogues. Lines are non-linear fits shown for visualisation only.
Current usage metrics show cumulative count of Article Views (full-text article views including HTML views, PDF and ePub downloads, according to the available data) and Abstracts Views on Vision4Press platform.
Data correspond to usage on the plateform after 2015. The current usage metrics is available 48-96 hours after online publication and is updated daily on week days.
Initial download of the metrics may take a while.