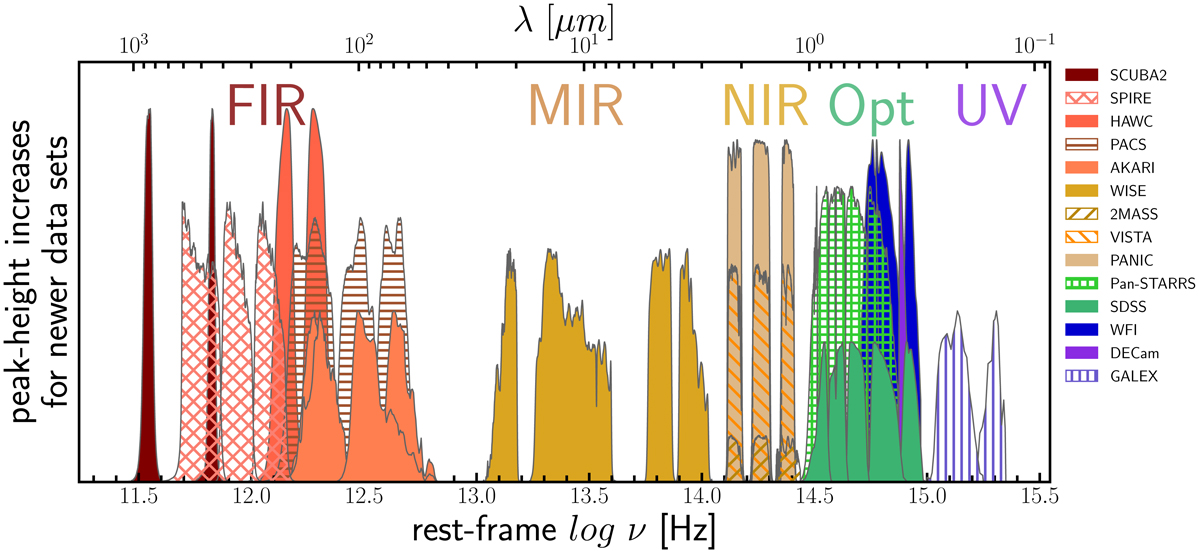
Fig. 1.
Download original image
Photometric broad bands from a number of surveys and instruments used for the SED modeling. The y-axis is normalized roughly by the year of observational campaign to visually compare bands with similar coverage. When more than one option was available for certain bands, the preference was given to the band sets, which are temporally closer to each other (especially in near infrared and optical ranges) to minimize the impact of AGN variability.
Current usage metrics show cumulative count of Article Views (full-text article views including HTML views, PDF and ePub downloads, according to the available data) and Abstracts Views on Vision4Press platform.
Data correspond to usage on the plateform after 2015. The current usage metrics is available 48-96 hours after online publication and is updated daily on week days.
Initial download of the metrics may take a while.