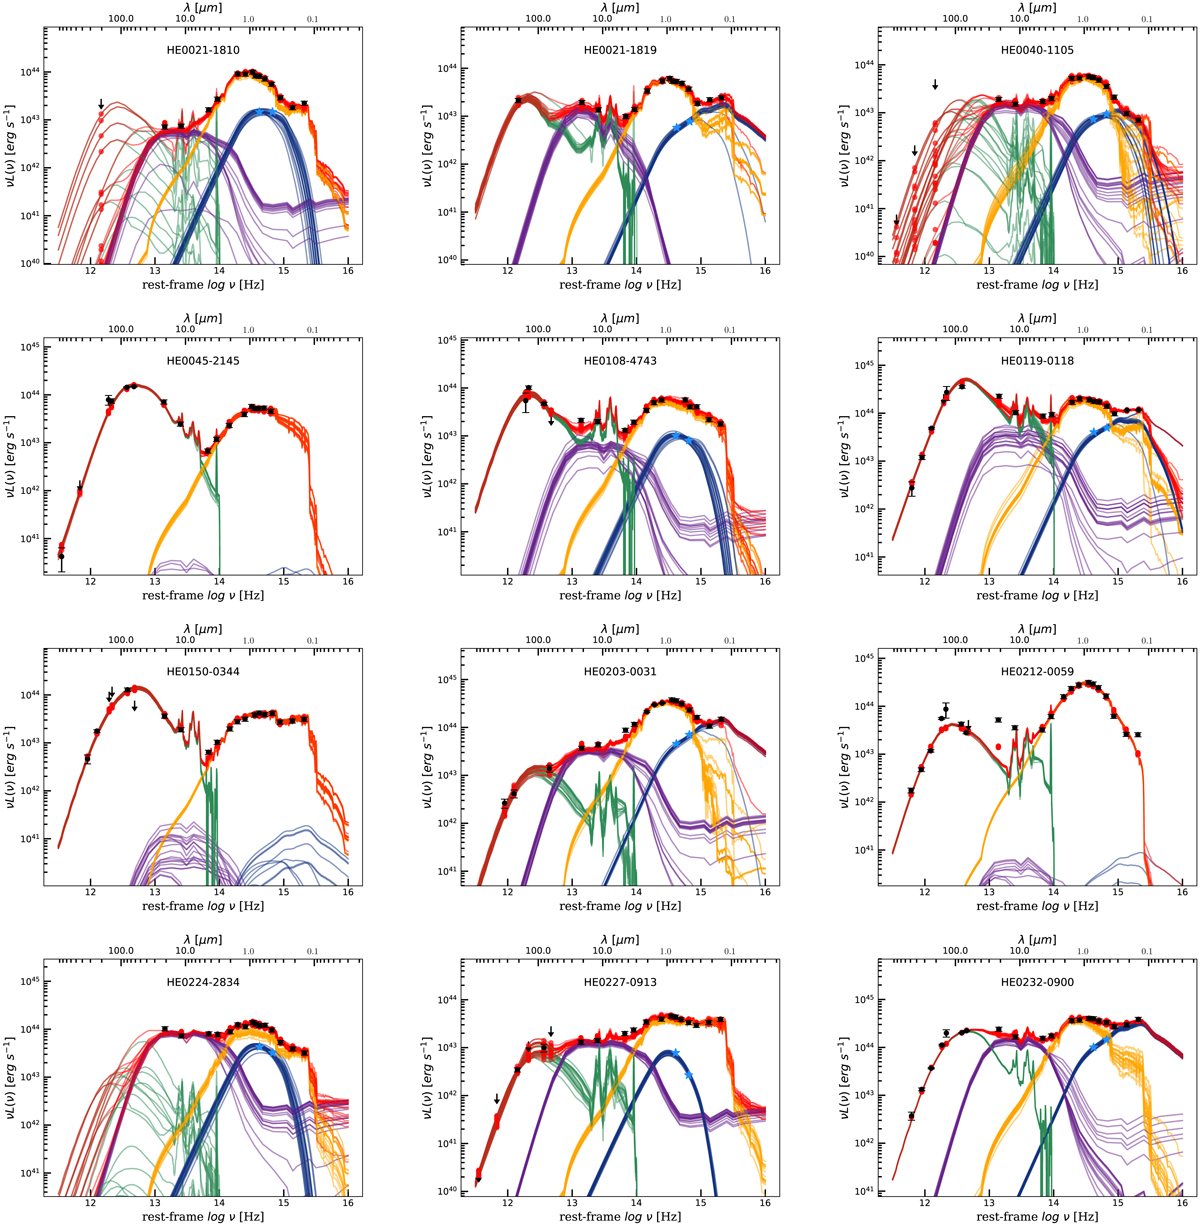
Fig. A.1.
Download original image
Overview of the AGNfitter SED modeling results for the entire CARS sample. Black data points represent the measured panchromatic photometry collected for each object. Upper limits are highlighted as black arrows. The red dots are the predicted photometry for XX MCMC relations from the superposition of individual SED components. The red, yellow, blue, purple and green lines correspond to the total SED, the stellar component, the AGN component, the hot dust component and the cold dust component, respectively.
Current usage metrics show cumulative count of Article Views (full-text article views including HTML views, PDF and ePub downloads, according to the available data) and Abstracts Views on Vision4Press platform.
Data correspond to usage on the plateform after 2015. The current usage metrics is available 48-96 hours after online publication and is updated daily on week days.
Initial download of the metrics may take a while.