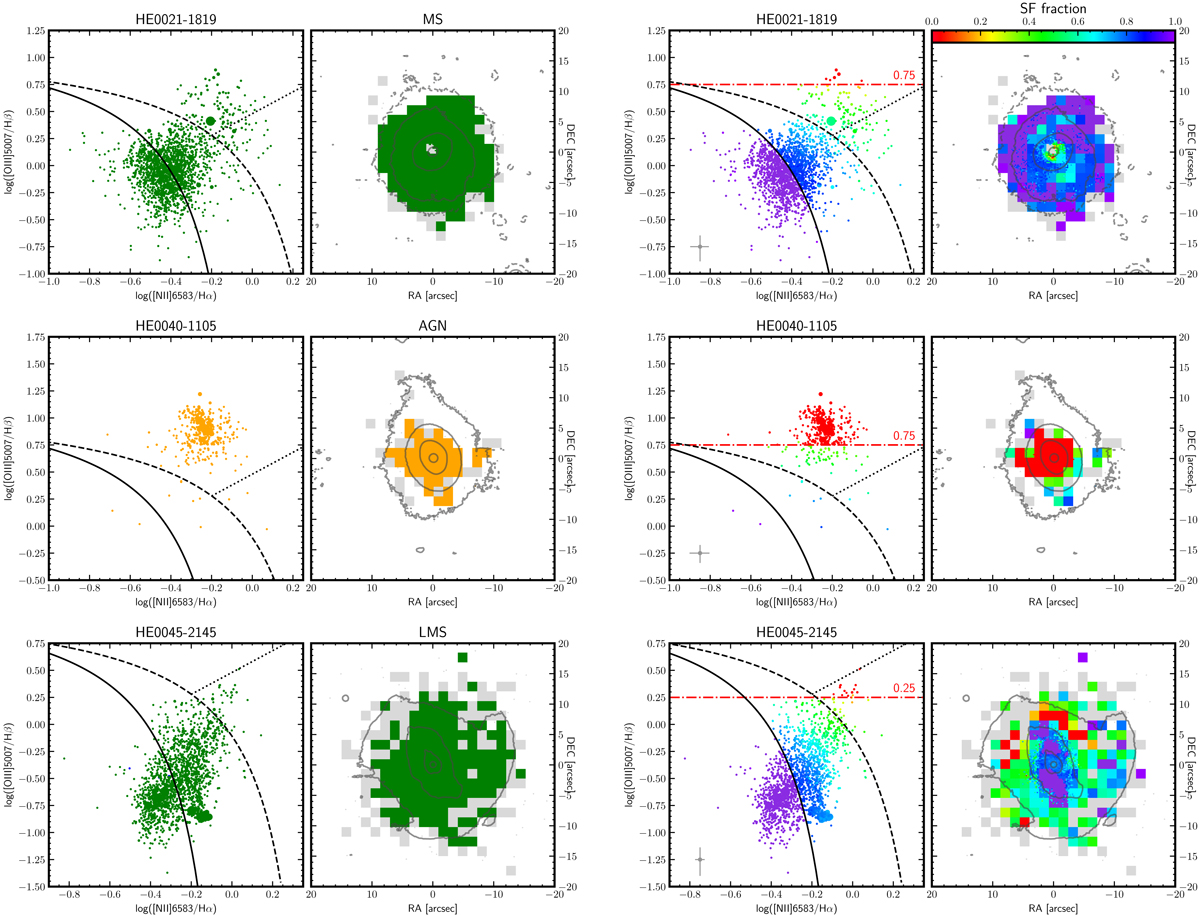
Fig. B.1.
Download original image
BPT morphology and RAINBOW results for the sample. The BPT and a spatial map for each galaxy show SF fraction. The red dotted line shows the threshold for the AGN basis spaxels. The contours on the maps represent MUSE whitelight contours. The gray pixels on the maps represent those pixels, where Hα S/N is more than 3σ, but the other lines are weaker so the datapoint cannot be shown on a BPT.
Current usage metrics show cumulative count of Article Views (full-text article views including HTML views, PDF and ePub downloads, according to the available data) and Abstracts Views on Vision4Press platform.
Data correspond to usage on the plateform after 2015. The current usage metrics is available 48-96 hours after online publication and is updated daily on week days.
Initial download of the metrics may take a while.