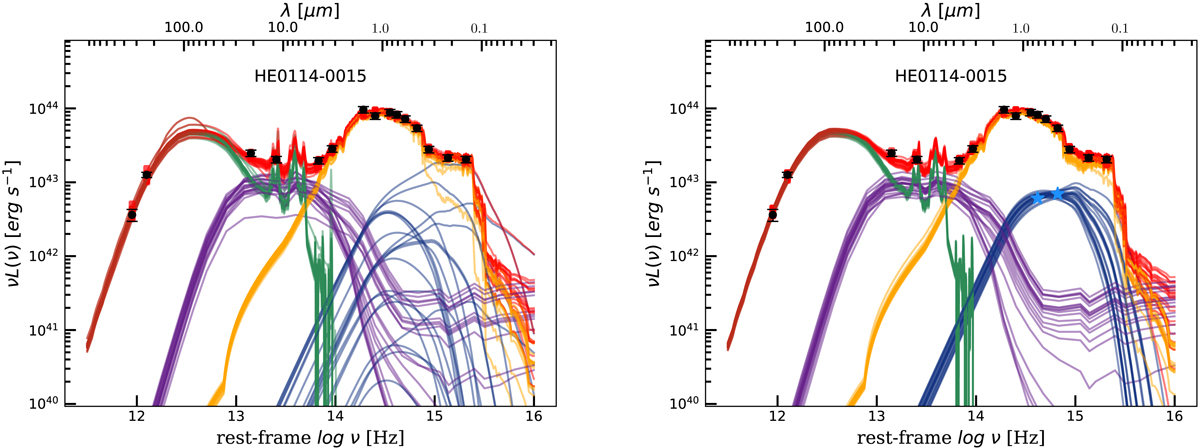
Fig. 2.
Download original image
SED for HE 0114−0015 and the best-fit model determined by AGNfitter (Calistro Rivera et al. 2016). 20 MCMC realizations of the SED model are shown for the broadband photometric data (black points with error bars) where the red points are the corresponding predictions from the model. The red lines represent the total model, which consists of four components: the cold and warm dust in star-forming regions (green lines), the torus of AGN-heated dust (purple lines), the stellar continuum (yellow lines), and the AGN accretion disk (blue lines). On the right panel is an additional constraint to the accretion disk model (e.g. g and i AGN photometry is included).
Current usage metrics show cumulative count of Article Views (full-text article views including HTML views, PDF and ePub downloads, according to the available data) and Abstracts Views on Vision4Press platform.
Data correspond to usage on the plateform after 2015. The current usage metrics is available 48-96 hours after online publication and is updated daily on week days.
Initial download of the metrics may take a while.