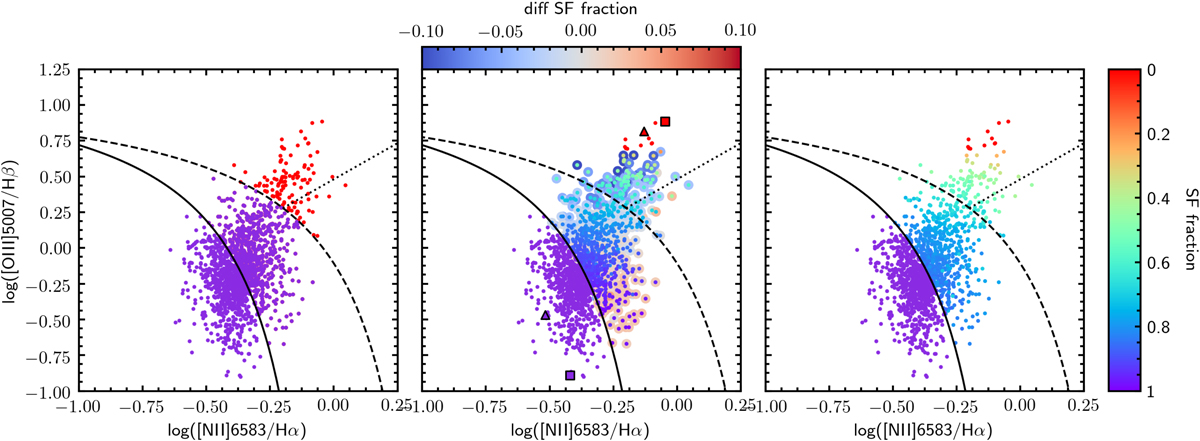
Fig. 3.
Download original image
BPT diagram of HE 0853+0102 as an example for a mixing sequence between H II regions and AGN photoionization across the host galaxy. We highlight three ways of determining the SF fraction from the BPT diagram. Left panel: a simple demarcation line approach where everything above the Kewley et al. (2001) line is classified as pure AGN and below as pure star formation. Middle panel: simple linear combination with a χ2 fit using a fixed line vector as a reference point for the characteristic AGN and H II line ratios. The colored halos around the points represent the difference between the calculated SF fraction adopting two different different reference pairs (triangle and square symbols) to highlight the systematic uncertainties introduced by a certain choice. Right panel: MCMC fitting results of the star formation fraction adopting a large cloud of potential reference points for the AGN (red points) and H II region (magenta points) which are explored during the MCMC sampling.
Current usage metrics show cumulative count of Article Views (full-text article views including HTML views, PDF and ePub downloads, according to the available data) and Abstracts Views on Vision4Press platform.
Data correspond to usage on the plateform after 2015. The current usage metrics is available 48-96 hours after online publication and is updated daily on week days.
Initial download of the metrics may take a while.