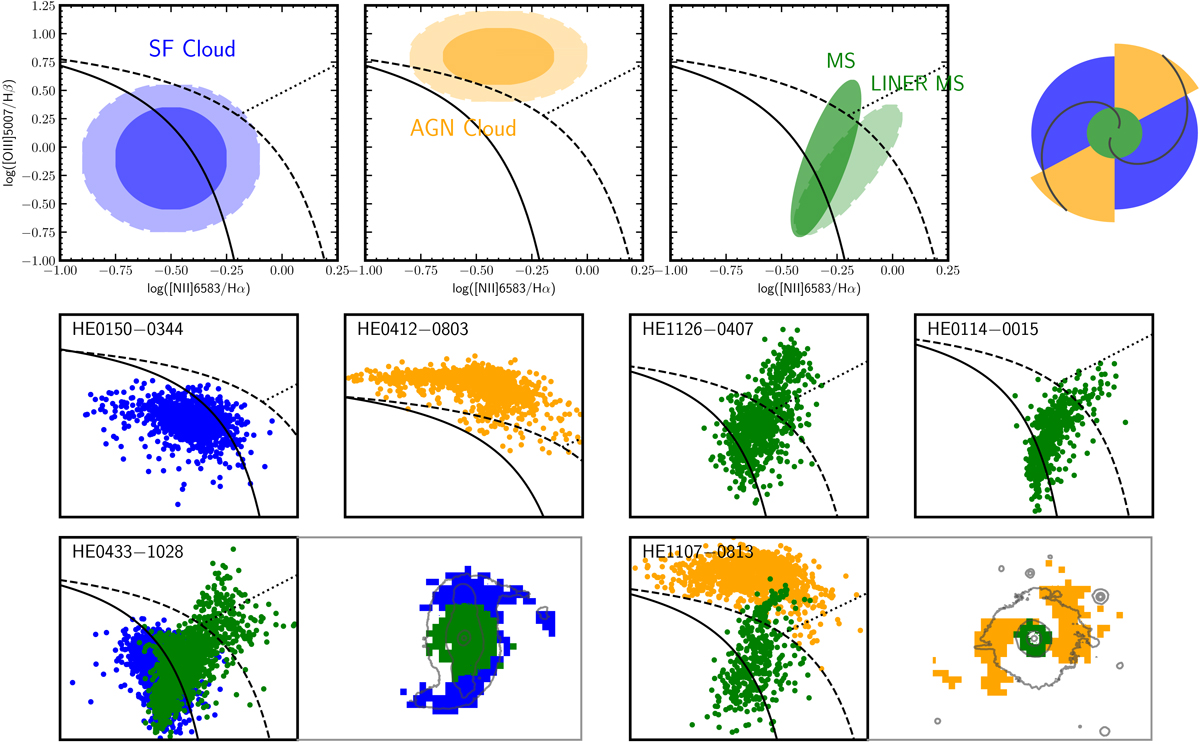
Fig. 4.
Download original image
Schematic sketch of the BPT morphology populations. Upper row: on the right there is a representation of a galaxy with a central region in green, the rest of the galactic body in blue, and an AGN ionization cone in yellow. These regions populate specific areas on the BPT diagram: left diagram: star-forming cloud with two different sizes; middle diagram: AGN-ionized cloud with two sizes; right diagram: mixing sequence elongated toward the AGN area and a mixing sequence elongated toward the LINER area. Middle row: BPT diagram schematic examples for the SF cloud, AGN cloud, mixing sequence and LINER mixing sequence dominated galaxies. Lower row: BPT diagram and spatial map examples for SF cloud and AGN cloud combined with a mixing sequence in one galaxy.
Current usage metrics show cumulative count of Article Views (full-text article views including HTML views, PDF and ePub downloads, according to the available data) and Abstracts Views on Vision4Press platform.
Data correspond to usage on the plateform after 2015. The current usage metrics is available 48-96 hours after online publication and is updated daily on week days.
Initial download of the metrics may take a while.