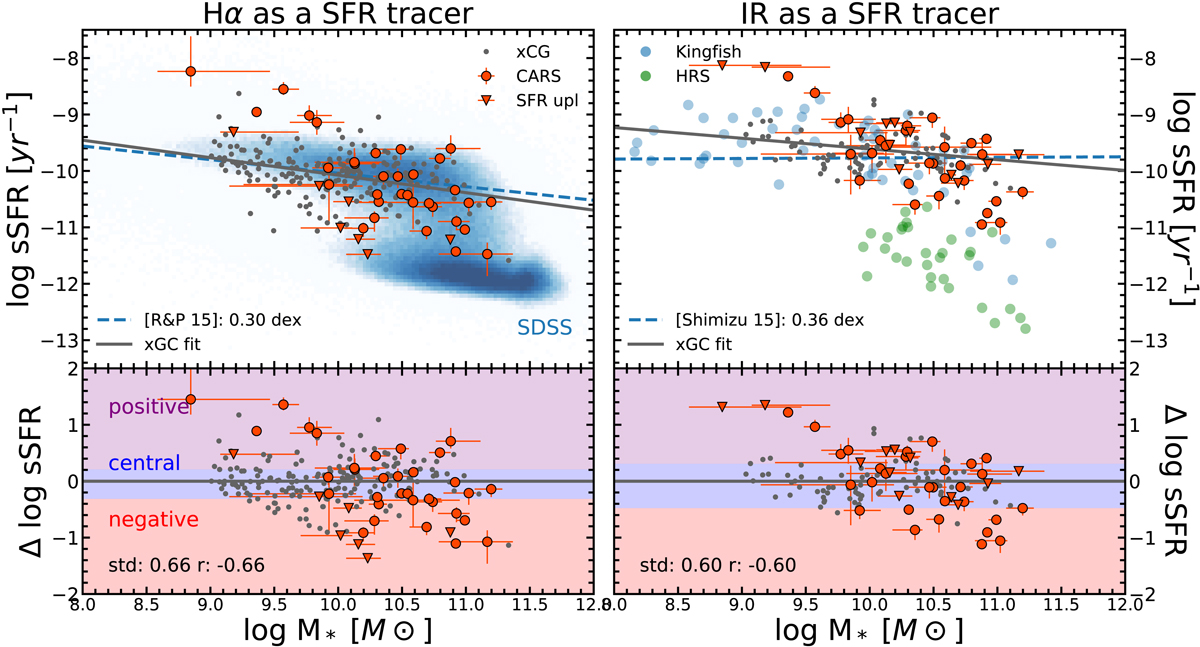
Fig. 6.
Download original image
Comparison of the sSFR against stellar mass for Hα- and IR-based SFR tracers. The CARS objects are shown as red points with error bars, while xCOLD GASS (xCG) are in small gray dots, KINGFISH are in blue and Herschel Reference Survey (HRS) in green. Specific SFR is calculated from Hα luminosity (left panel) derived after BPT morphology analysis and RAINBOW fitting using the SFR formula SFRHα = 5.3 × 10−42 × LHα (Calzetti et al. 2007). IR specific SFR (right panel) derived from the AGNFITTER modeling using the Murphy et al. (2011) SFR formula. The stellar mass is taken from the AGNFITTER modeling parameters. The background on the left plot is the density map of SDSS galaxies (Brinchmann et al. 2004). Linear models to the star-forming main sequence are shown as black solid lines from Renzini & Peng (2015) and Shimizu et al. (2015), respectively. The best-fit linear relation from the xCG sample is shown as the blue dashed line in both cases. Lower panel: residuals around the adopted star-forming main sequence where the colored bands (red, blue, and purple) emphasize three bins used further in Fig. 8.
Current usage metrics show cumulative count of Article Views (full-text article views including HTML views, PDF and ePub downloads, according to the available data) and Abstracts Views on Vision4Press platform.
Data correspond to usage on the plateform after 2015. The current usage metrics is available 48-96 hours after online publication and is updated daily on week days.
Initial download of the metrics may take a while.