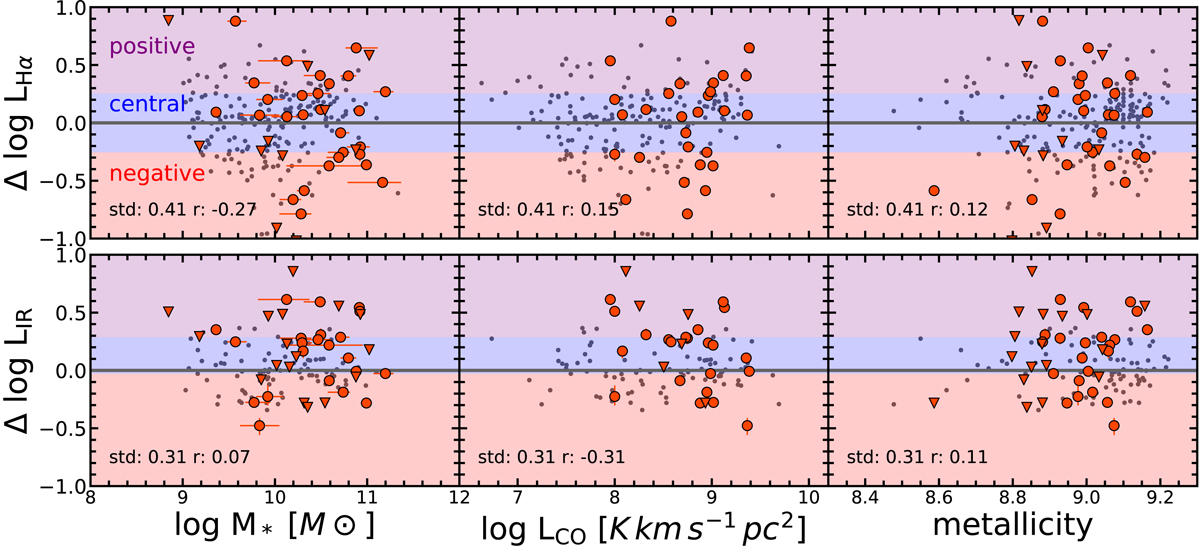
Fig. 7.
Download original image
Difference between measured and expected Hα (upper panels) and FIR luminosity (lower panels) as a function of stellar mass, CO(1−0) luminosity and 12 + log(O/H) ionized gas metallicity. Here we used our more complex model (Eqs. (1) and (2)) to predict the SFR-sensitive luminosities. The black dots are the data from our xCG training sample and the red symbols are the CARS data with triangles indicating upper limits. The colored bands (red, blue and purple) define three bins in residual luminosity as discussed in the text and used for Fig. 8.
Current usage metrics show cumulative count of Article Views (full-text article views including HTML views, PDF and ePub downloads, according to the available data) and Abstracts Views on Vision4Press platform.
Data correspond to usage on the plateform after 2015. The current usage metrics is available 48-96 hours after online publication and is updated daily on week days.
Initial download of the metrics may take a while.