Fig. 9.
Download original image
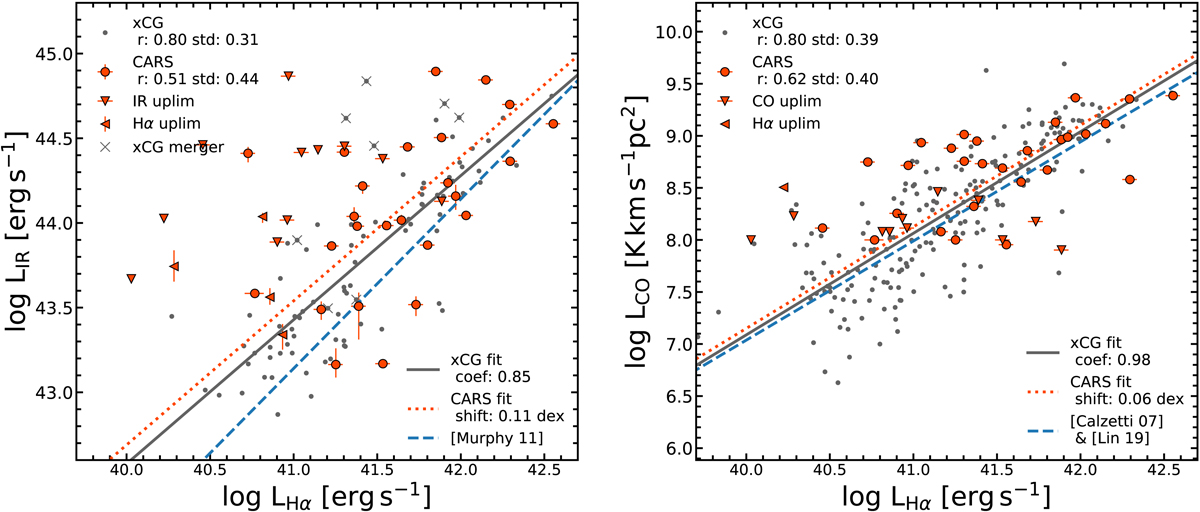
8−1000 μm IR luminosity LIR (left panel) and the CO (1−0) luminosity LCO (right panel) plotted against Hα luminosity. The training sample from the xCG (gray dots) is compared to the CARS objects (red circles and triangles for the 5σ upper limits). Galaxy mergers in the xCG sample as classified by GalaxyZoo2 are additionally marked (black crosses) on the left panel. The blue dashed line corresponds to Eqs. (12) and (13) are derived by the combination of literature calibrations as described in the main text. The black lines represent a linear relation fitted to the XCOLD GASS reference sample, see Eqs. (14) and (15). The red dotted line is fitted to the CARS objects with the same slope as the black line, therefore highlight the shift in the normalization.
Current usage metrics show cumulative count of Article Views (full-text article views including HTML views, PDF and ePub downloads, according to the available data) and Abstracts Views on Vision4Press platform.
Data correspond to usage on the plateform after 2015. The current usage metrics is available 48-96 hours after online publication and is updated daily on week days.
Initial download of the metrics may take a while.