Fig. 5
Download original image
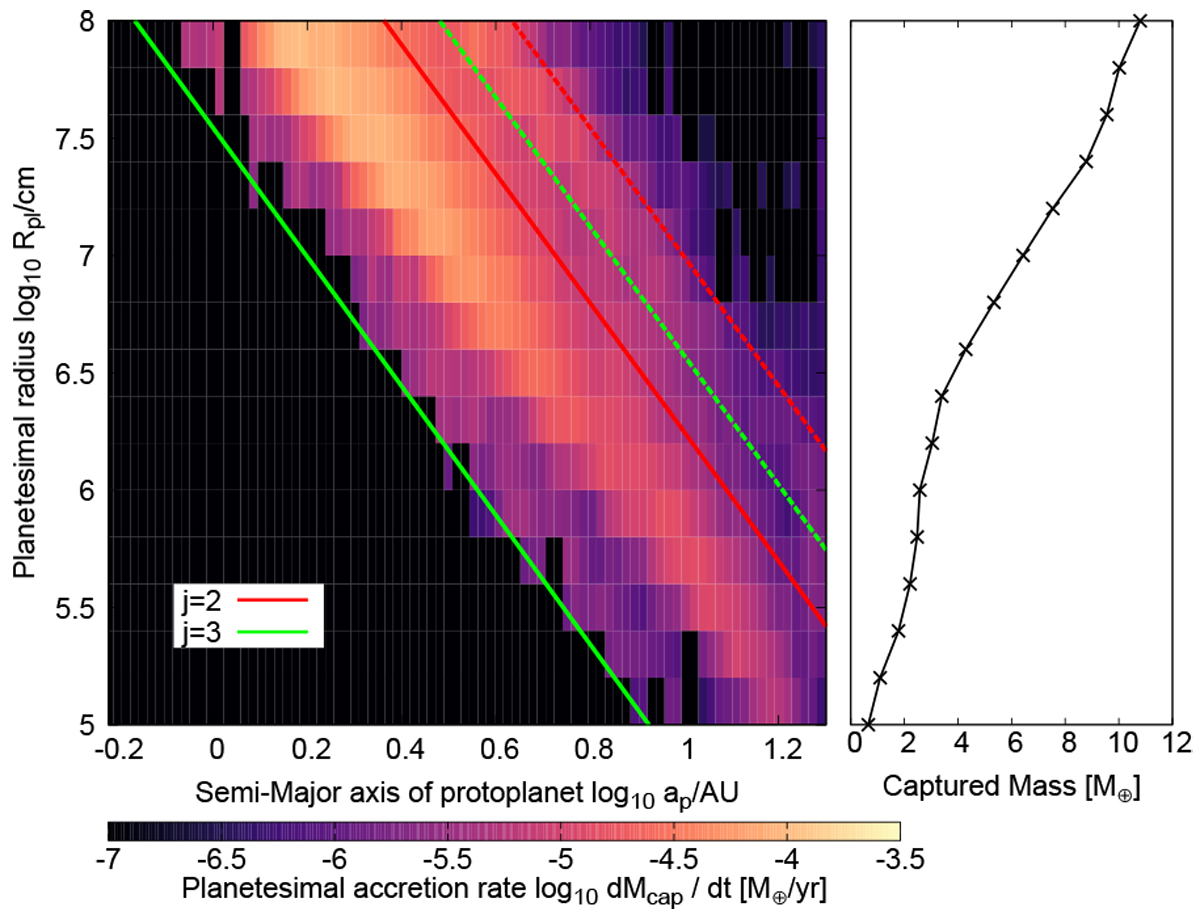
Results of the parameter study regarding the size of planetesimals Rpl. Left: planetesimal accretion rate shown as a colour contour on a plane of the semi-major axis of the migrating protoplanets and the radius of the planetesimals, The analytically predicted inner and outer boundaries of the sweet spot are indicated with solid and dashed lines, respectively. The red lines are for j = 2 and the green lines are for j = 3. Right: total mass of captured planetesimals as a function of the planetesimal radius.
Current usage metrics show cumulative count of Article Views (full-text article views including HTML views, PDF and ePub downloads, according to the available data) and Abstracts Views on Vision4Press platform.
Data correspond to usage on the plateform after 2015. The current usage metrics is available 48-96 hours after online publication and is updated daily on week days.
Initial download of the metrics may take a while.