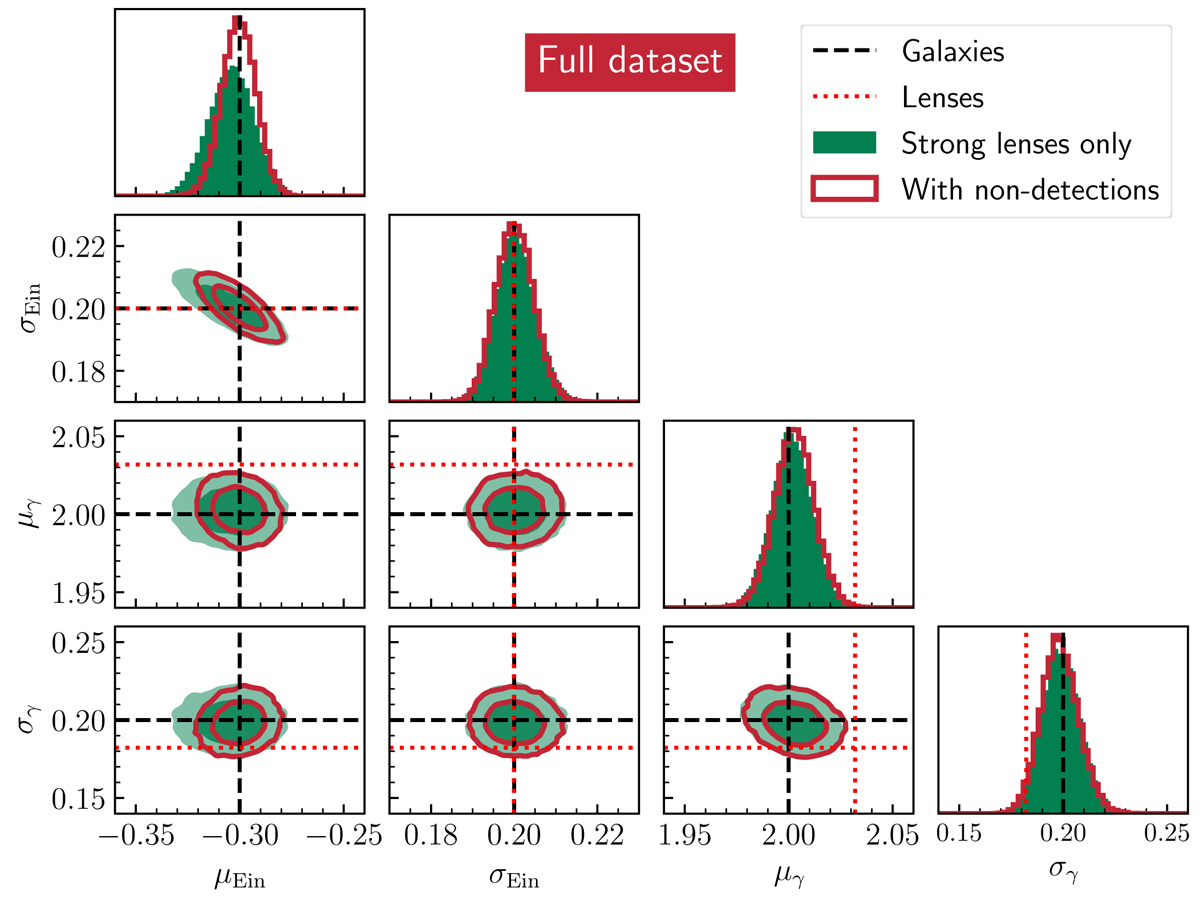
Fig. 5.
Download original image
Posterior probability distribution of the galaxy population model parameters, η, obtained by fitting only the strong lenses (green filled contours) and the full sample (red solid contour lines). All of the available lensing data (image positions and magnitudes) were used for the fit. Black dashed lines mark the true values of the parameters. Red dotted lines indicate the values of the parameters obtained by fitting the model of Eq. (28) to the subsample of strong lenses (the mean log θEin parameter value is μEin = −0.12, which is outside of the plot range).
Current usage metrics show cumulative count of Article Views (full-text article views including HTML views, PDF and ePub downloads, according to the available data) and Abstracts Views on Vision4Press platform.
Data correspond to usage on the plateform after 2015. The current usage metrics is available 48-96 hours after online publication and is updated daily on week days.
Initial download of the metrics may take a while.