Open Access
Fig. 7
Download original image
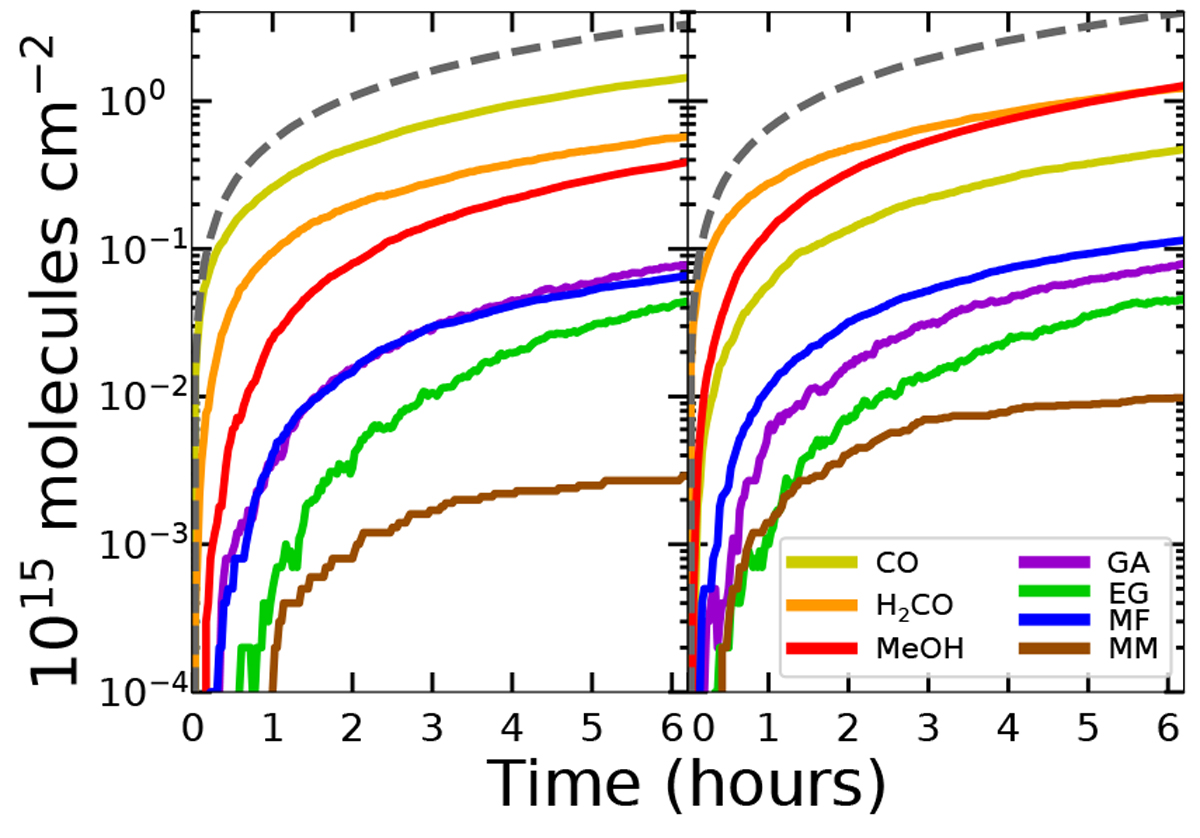
Surface abundance of stable species during benchmark simulations of CO + H (left) and H2CO + H (right) co-deposition. These are simulations of Exp. 3 and 5 as listed in Table 1. The dashed line is the total amount of C deposited.
Current usage metrics show cumulative count of Article Views (full-text article views including HTML views, PDF and ePub downloads, according to the available data) and Abstracts Views on Vision4Press platform.
Data correspond to usage on the plateform after 2015. The current usage metrics is available 48-96 hours after online publication and is updated daily on week days.
Initial download of the metrics may take a while.