Free Access
Fig. 3.
Download original image
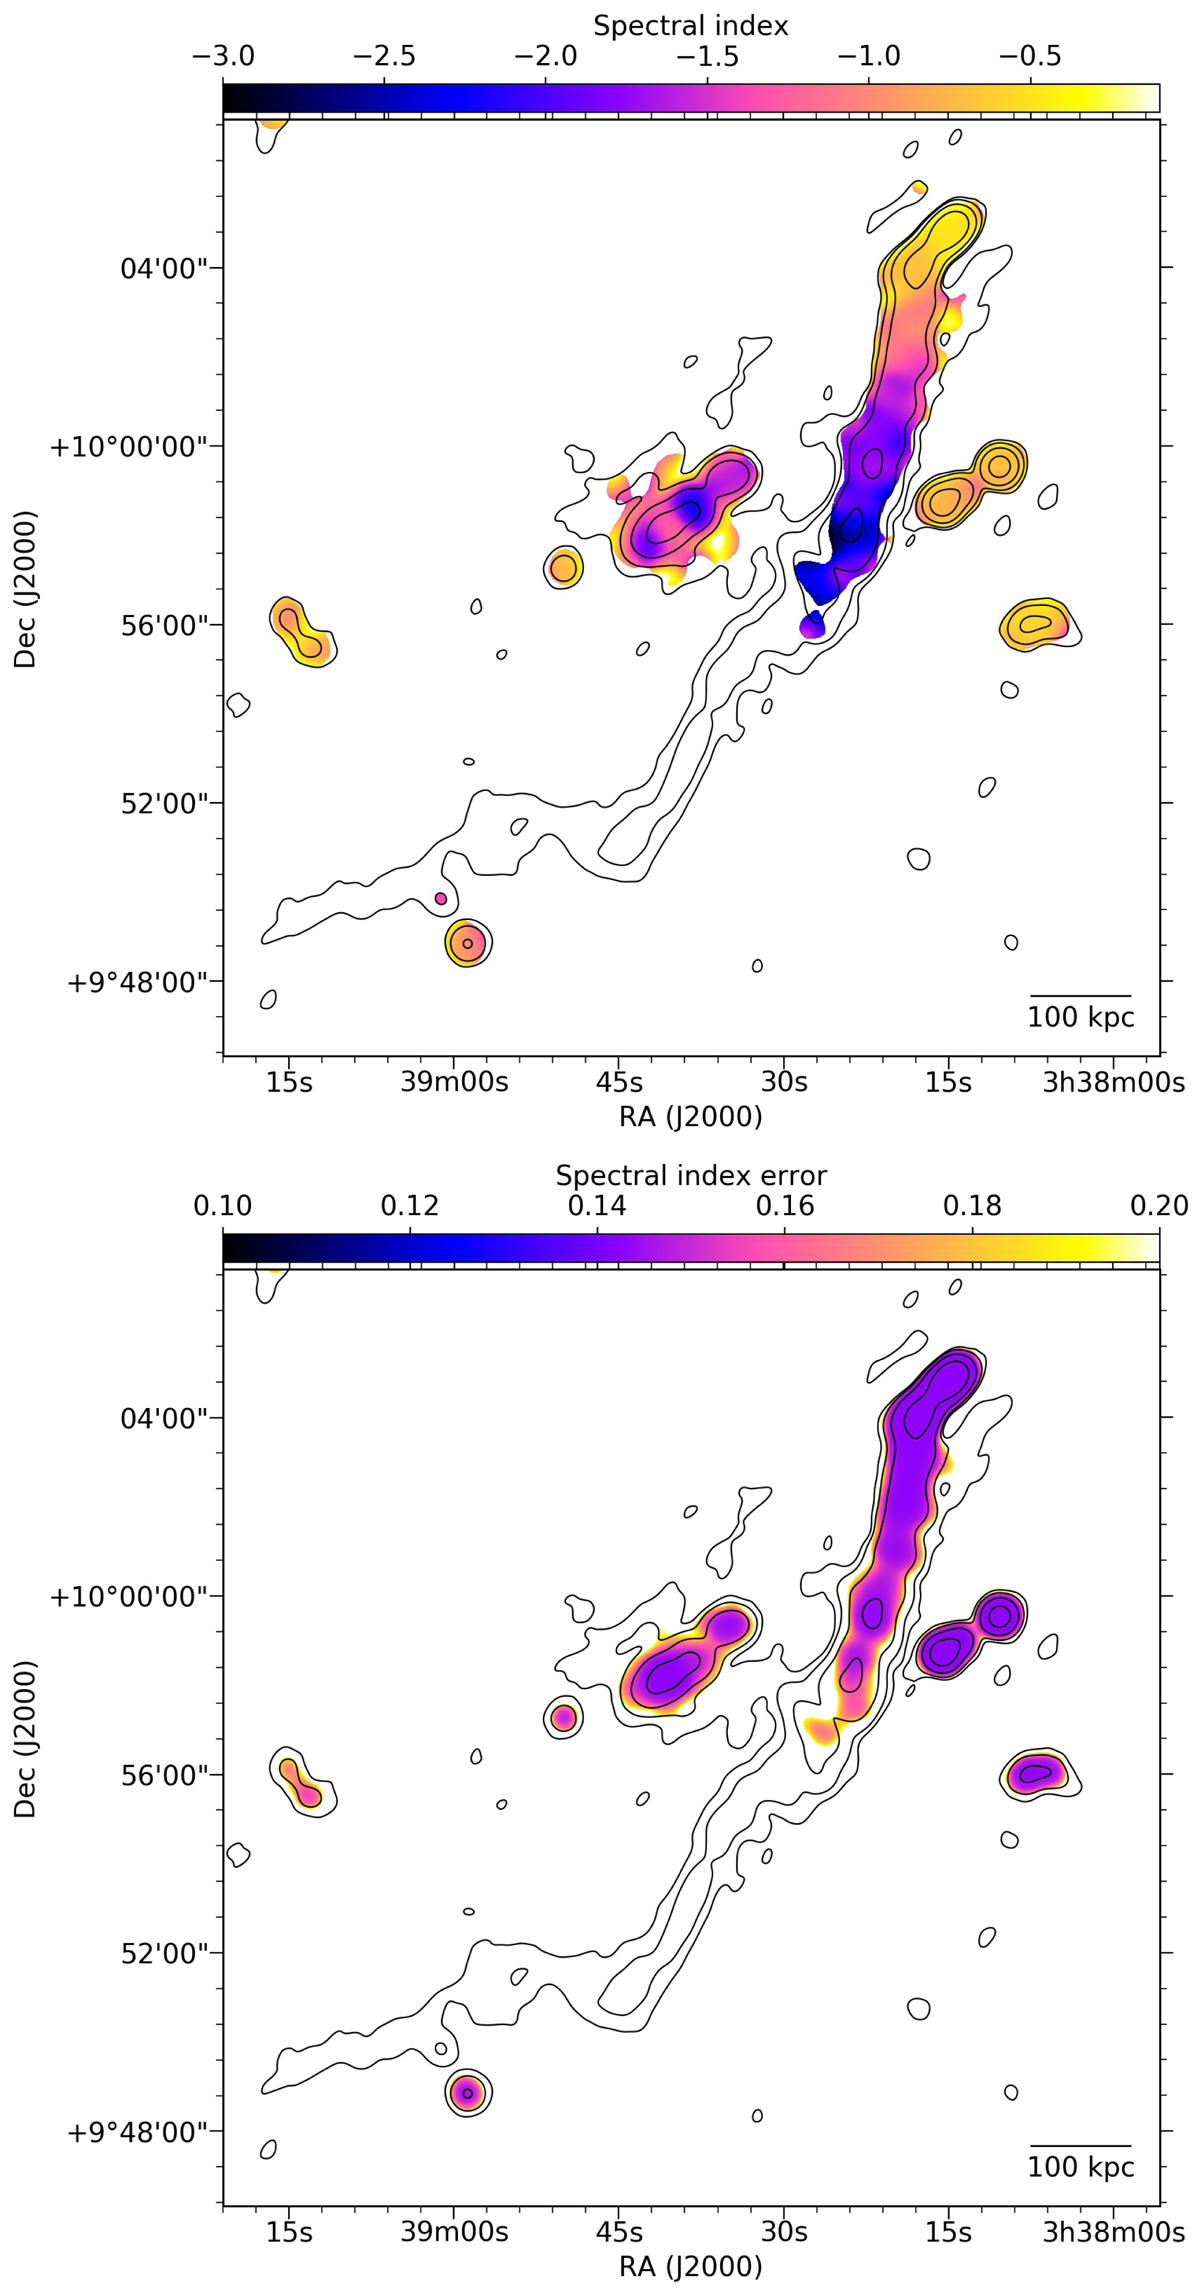
Spectral index map between 144 and 610 MHz (top) and the corresponding error map (bottom). We report the 3, 12, 48, and 192σ contours of the 144 MHz images (σ = 750 μJy beam−1) produced to map the spectral index.
Current usage metrics show cumulative count of Article Views (full-text article views including HTML views, PDF and ePub downloads, according to the available data) and Abstracts Views on Vision4Press platform.
Data correspond to usage on the plateform after 2015. The current usage metrics is available 48-96 hours after online publication and is updated daily on week days.
Initial download of the metrics may take a while.