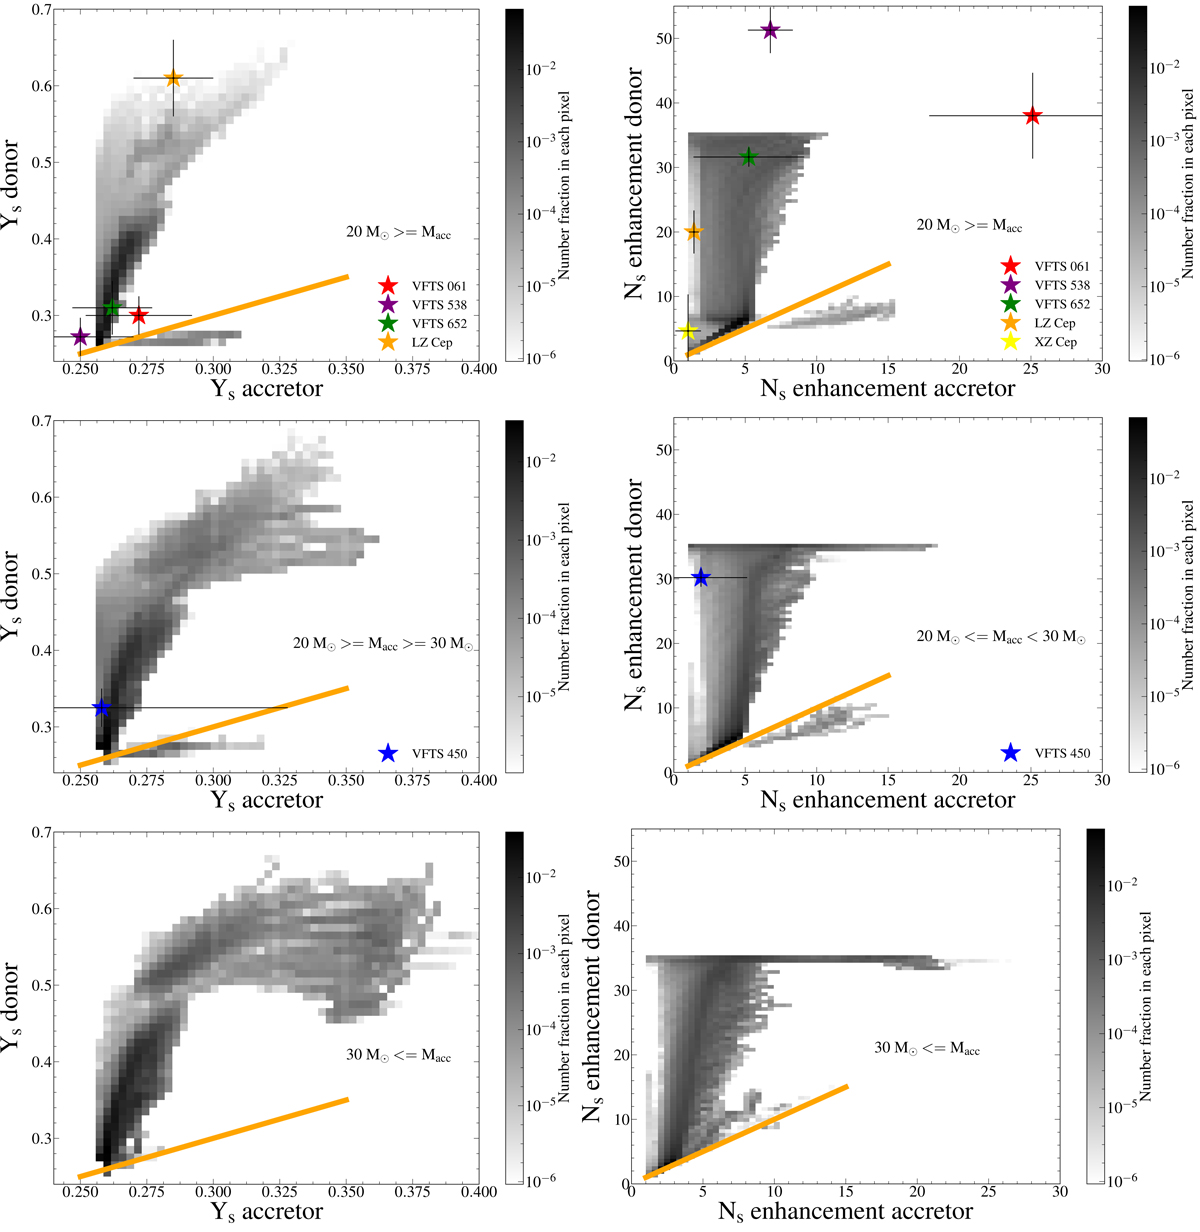
Fig. B.2.
Download original image
Probability distribution of the surface helium mass fraction (left three panels) and surface nitrogen mass fraction enhancement factors (right three panels) of the donor vs the accretor for different ranges of accretor masses during the semi-detached phase: below 20 M⊙ (top panels), 20-30 M⊙ (middle panels) and above 30 M⊙ (bottom panels). The different coloured stars symbols with error bars denote the positions of the semi-detached systems from the TMBM survey (Mahy et al. 2020a,b). The orange line indicates where the donor and accretor abundances are the same. The grey-scale gives the probability fraction in each pixel. The total probability is normalised such that the sum over the entire area equals unity.
Current usage metrics show cumulative count of Article Views (full-text article views including HTML views, PDF and ePub downloads, according to the available data) and Abstracts Views on Vision4Press platform.
Data correspond to usage on the plateform after 2015. The current usage metrics is available 48-96 hours after online publication and is updated daily on week days.
Initial download of the metrics may take a while.