Fig. 3
Download original image
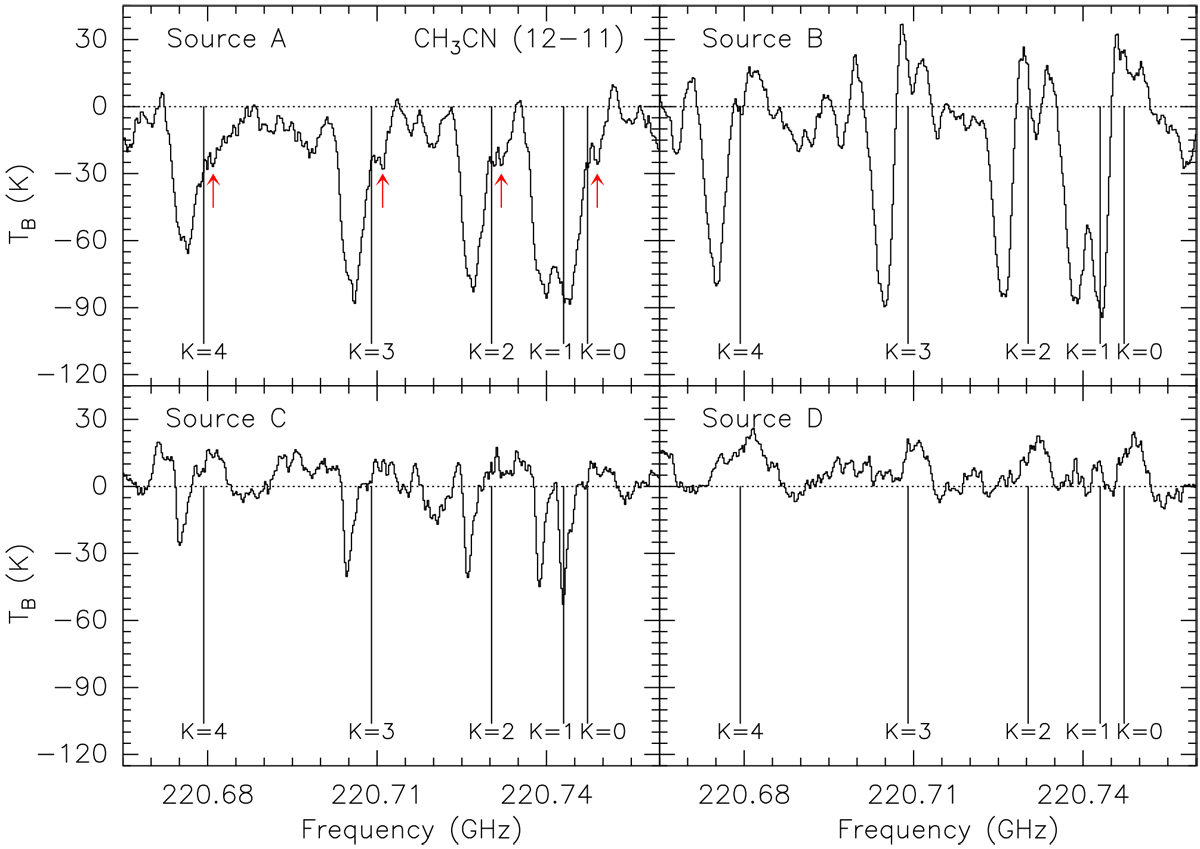
CH3CN (12–11) spectra of the K = 0, 1, 2, 3, and 4 transitions averaged over a beam toward the position of the dust continuum emission peak of the four sources embedded in the Main core of G31. The black lines indicate the different K components shifted to the frequency of the ambient gas velocity (96.5 km s−1). The red arrows in the top left panel indicate the secondary absorption component at blueshifted velocities associated with source A.
Current usage metrics show cumulative count of Article Views (full-text article views including HTML views, PDF and ePub downloads, according to the available data) and Abstracts Views on Vision4Press platform.
Data correspond to usage on the plateform after 2015. The current usage metrics is available 48-96 hours after online publication and is updated daily on week days.
Initial download of the metrics may take a while.