Fig. 6
Download original image
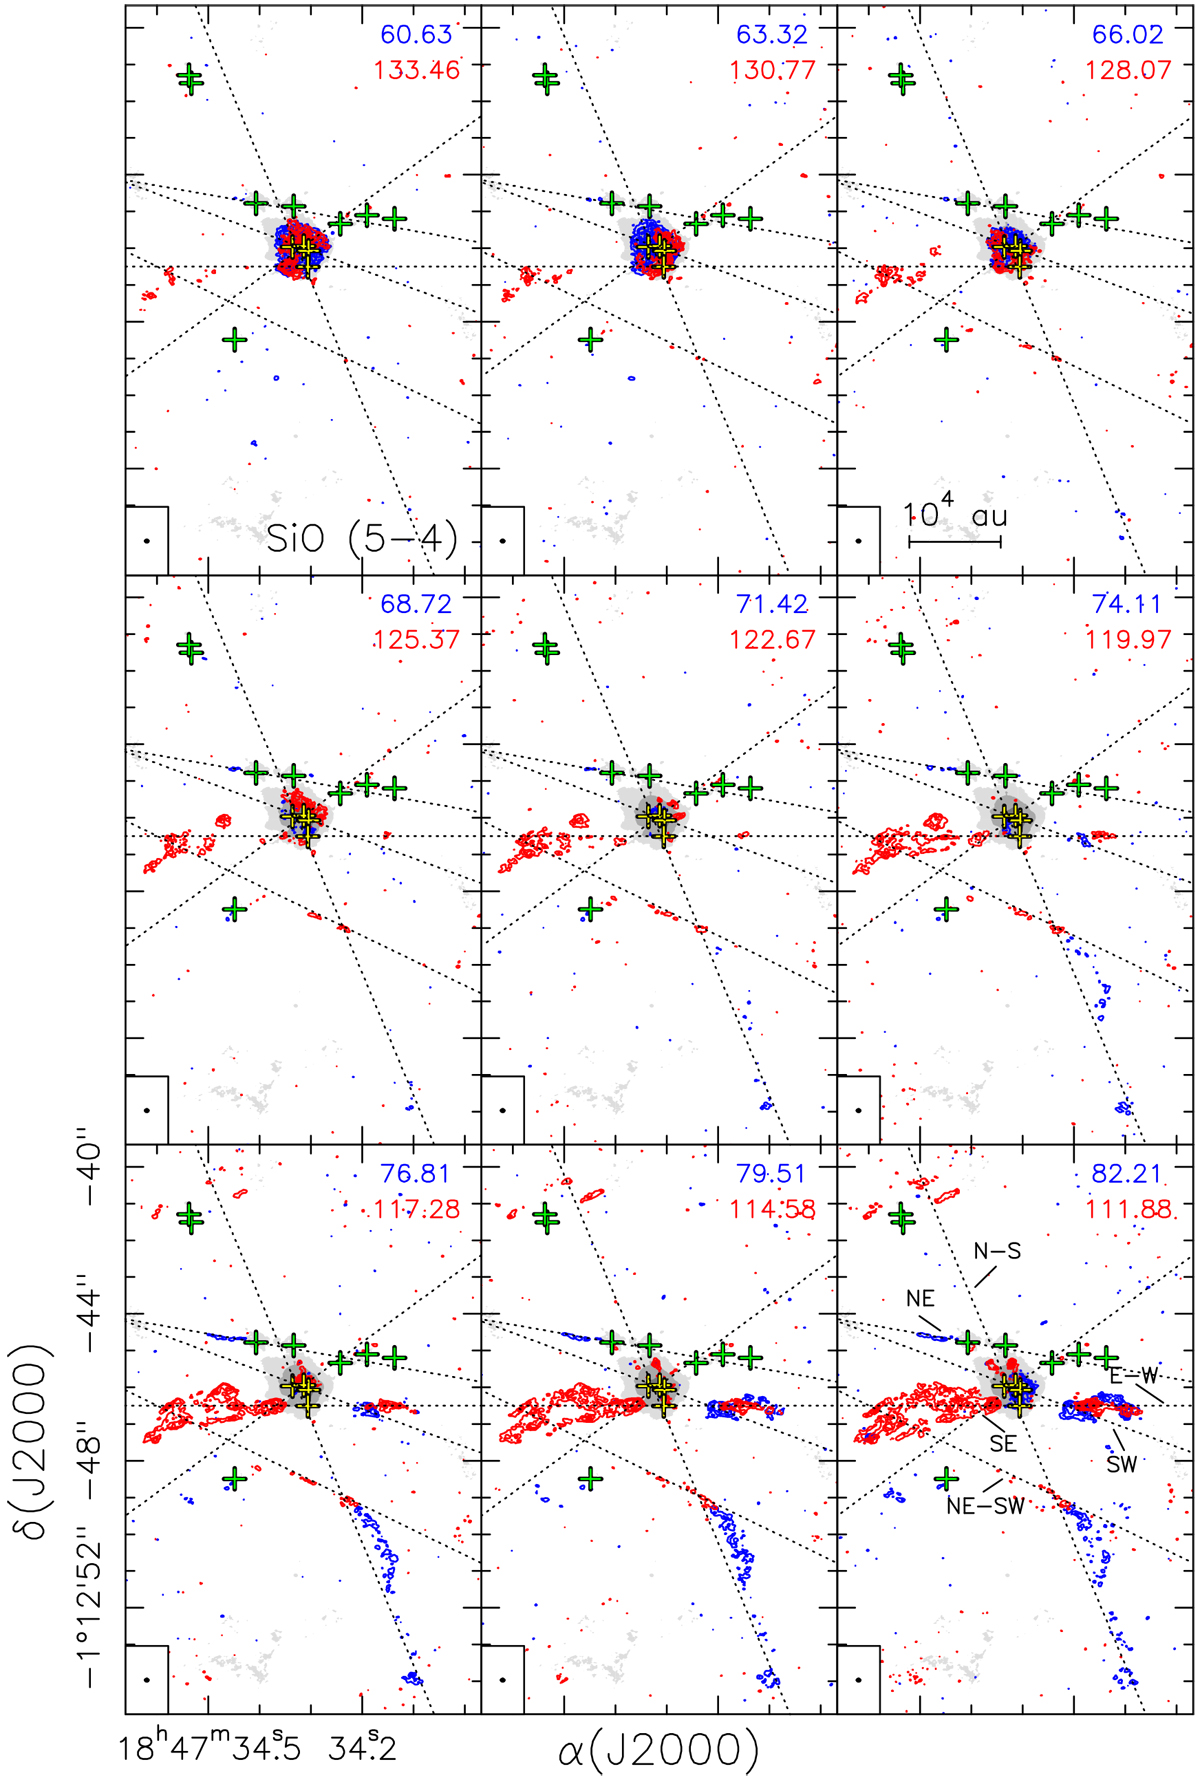
Velocity channel maps of the SiO (5–4) line emission (colors) overlaid on the 1.4 mm continuum emission (grayscale). Each box contains pairs of maps corresponding to the blue- (blue contours) and redshifted (red contours) emission at about the same velocity offset (in absolute value) from the systemic velocity (96.5 ± 0.5 km s−1). The corresponding LSR velocities are indicated at the top right of the box. The conversion factor from Jy beam−1 to K, in the Rayleigh-Jeans approximation, is 2844. Contour levels are 3, 6, 9, 12, 15, and 20 times 0.55 mJy beam−1. Grayscale levels are 3, 20, 83, and 165 times 1 σ times 0.32 mJy beam−1. The synthesized beam of 0.′′11 × 0.′′08, PA = − 83°, is shown in the lower left corner of each panel. The black dotted lines indicate the direction of the six outflows identified in G31 in this work. The labels of the outflows are indicated in the bottom right panel. The yellow crosses indicate the positions of the four continuum sources embedded in the Main core and the green crosses give the positions of the rest of the continuum sources detected in the region (Beltrán et al. 2021).
Current usage metrics show cumulative count of Article Views (full-text article views including HTML views, PDF and ePub downloads, according to the available data) and Abstracts Views on Vision4Press platform.
Data correspond to usage on the plateform after 2015. The current usage metrics is available 48-96 hours after online publication and is updated daily on week days.
Initial download of the metrics may take a while.