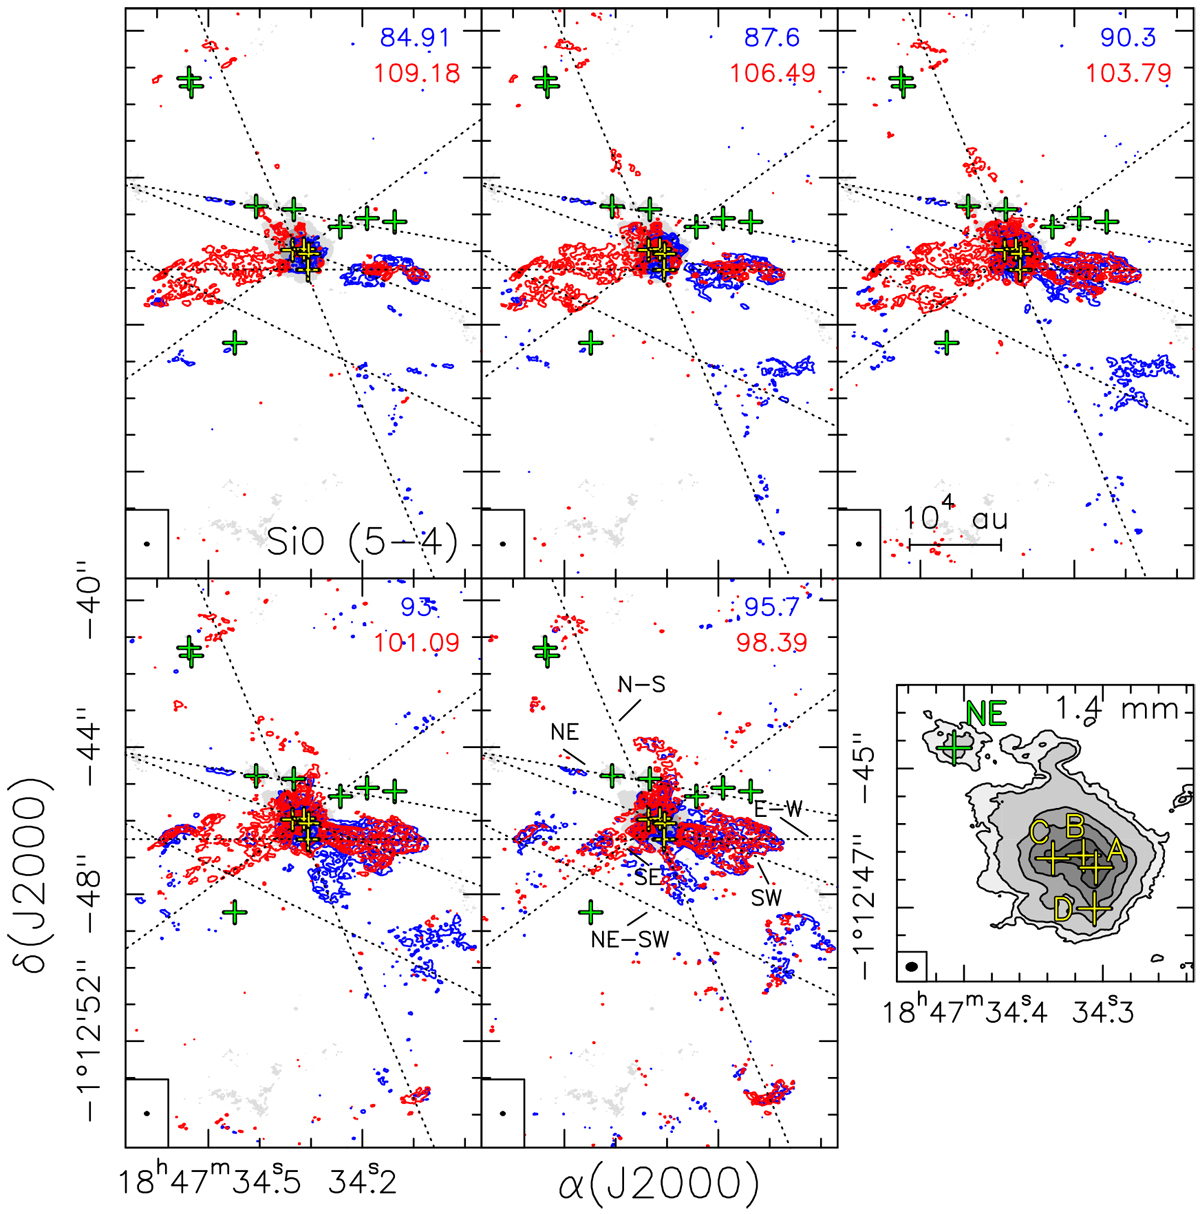
Fig. 6
Download original image
Continued. Colored contour levels are 3, 6, 9, 12, 15, 20, and 30 times 0.7 mJy beam−1. The bottom right panel is a close-up of the central region to better show the 1.4 mm continuum emission and the position of sources A, B, C, D, and NE. Grayscale and contour levels are 3, 6, 24, 48, 96, and 165 times 1 σ times 0.32 mJy beam−1.
Current usage metrics show cumulative count of Article Views (full-text article views including HTML views, PDF and ePub downloads, according to the available data) and Abstracts Views on Vision4Press platform.
Data correspond to usage on the plateform after 2015. The current usage metrics is available 48-96 hours after online publication and is updated daily on week days.
Initial download of the metrics may take a while.