Fig. 7
Download original image
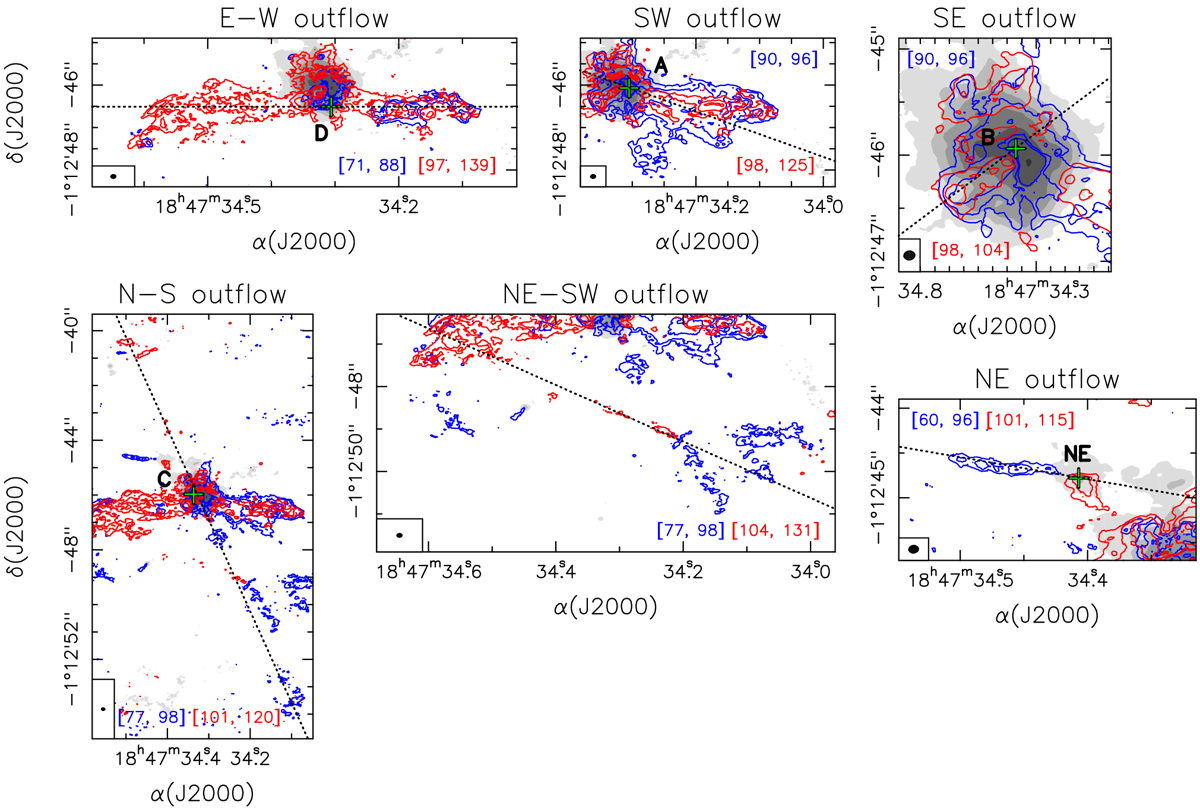
Overlay of the ALMA 1.4 mm continuum emission (grayscale) on the blueshifted (blue contours) and redshifted (red contours) SiO (5–4) emission averaged over different velocity intervals for the six outflows detected in the region. The velocity ranges within which the blueshifted and redshifted emission were averaged is indicated in square brackets in each panel. The systemic LSR velocity of G31 is 96.5 km s−1. Contour levels are 3, 6, 12, and 24 times 0.35 mJy beam−1 (blue and red) for the E–W and NE–SW outflows; 0.6 mJy beam−1 (blue) and 0.4 mJy beam−1 (red) for the SW outflow; 1.0 mJy beam−1 (blue) and 1.5 mJy beam−1 (red) for the SE outflow; 0.36 mJy beam−1 (blue) and 0.4 mJy beam−1 (red) for the N–S outflow; and 0.22 mJy beam−1 (blue) and 0.32 mJy beam−1 (red) for the NE outflow. The conversion factor from Jy beam−1 to K is 2844. Grayscale contours for the continuum emission are 0.96, 3.2, 6.4, 14.4, 28.8, and 54.4 mJy beam−1. The black dotted line indicates the direction of the outflow and the green cross the position of the suggested driving source.
Current usage metrics show cumulative count of Article Views (full-text article views including HTML views, PDF and ePub downloads, according to the available data) and Abstracts Views on Vision4Press platform.
Data correspond to usage on the plateform after 2015. The current usage metrics is available 48-96 hours after online publication and is updated daily on week days.
Initial download of the metrics may take a while.