Fig. 8
Download original image
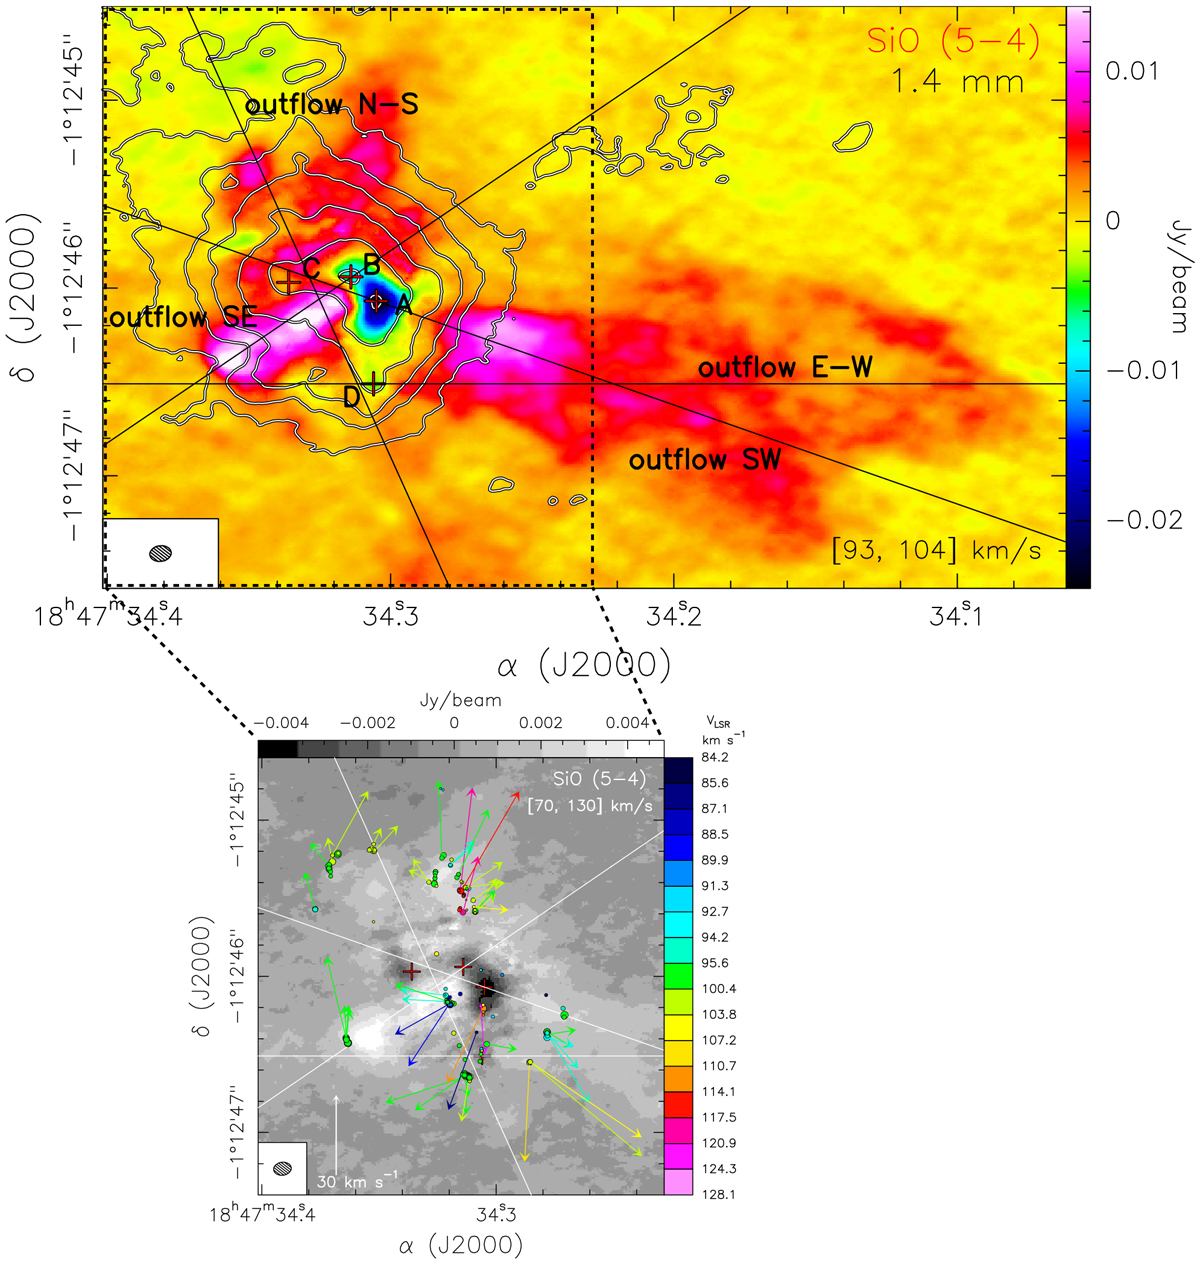
Close-up view of the SiO outflow emission associated with sources A, B, C, and D. Top panel: Overlay of the ALMA 1.4 mm continuum emission (grayscale) on the SiO (5–4) emission averaged over the (93, 104) km s−1 velocity interval. Contour levels are the same as in Fig. 6. Bottom panel: Close-up of the central region. The colored circles give the position of H2O masers, while the colored vectors indicate the direction and the amplitude of the proper motions (Moscadelli et al. 2013). The white vector in the bottom left corner indicates the amplitude scale of proper motions in kilometers per second. The synthesized beam is drawn in the bottom left corner of each panel. The red crosses give the positions of the continuum sources embedded in the Main core (Beltrán et al. 2021). The black (white) lines indicate the direction of the outflows driven by sources A, B, C, and D.
Current usage metrics show cumulative count of Article Views (full-text article views including HTML views, PDF and ePub downloads, according to the available data) and Abstracts Views on Vision4Press platform.
Data correspond to usage on the plateform after 2015. The current usage metrics is available 48-96 hours after online publication and is updated daily on week days.
Initial download of the metrics may take a while.