Fig. 5
Download original image
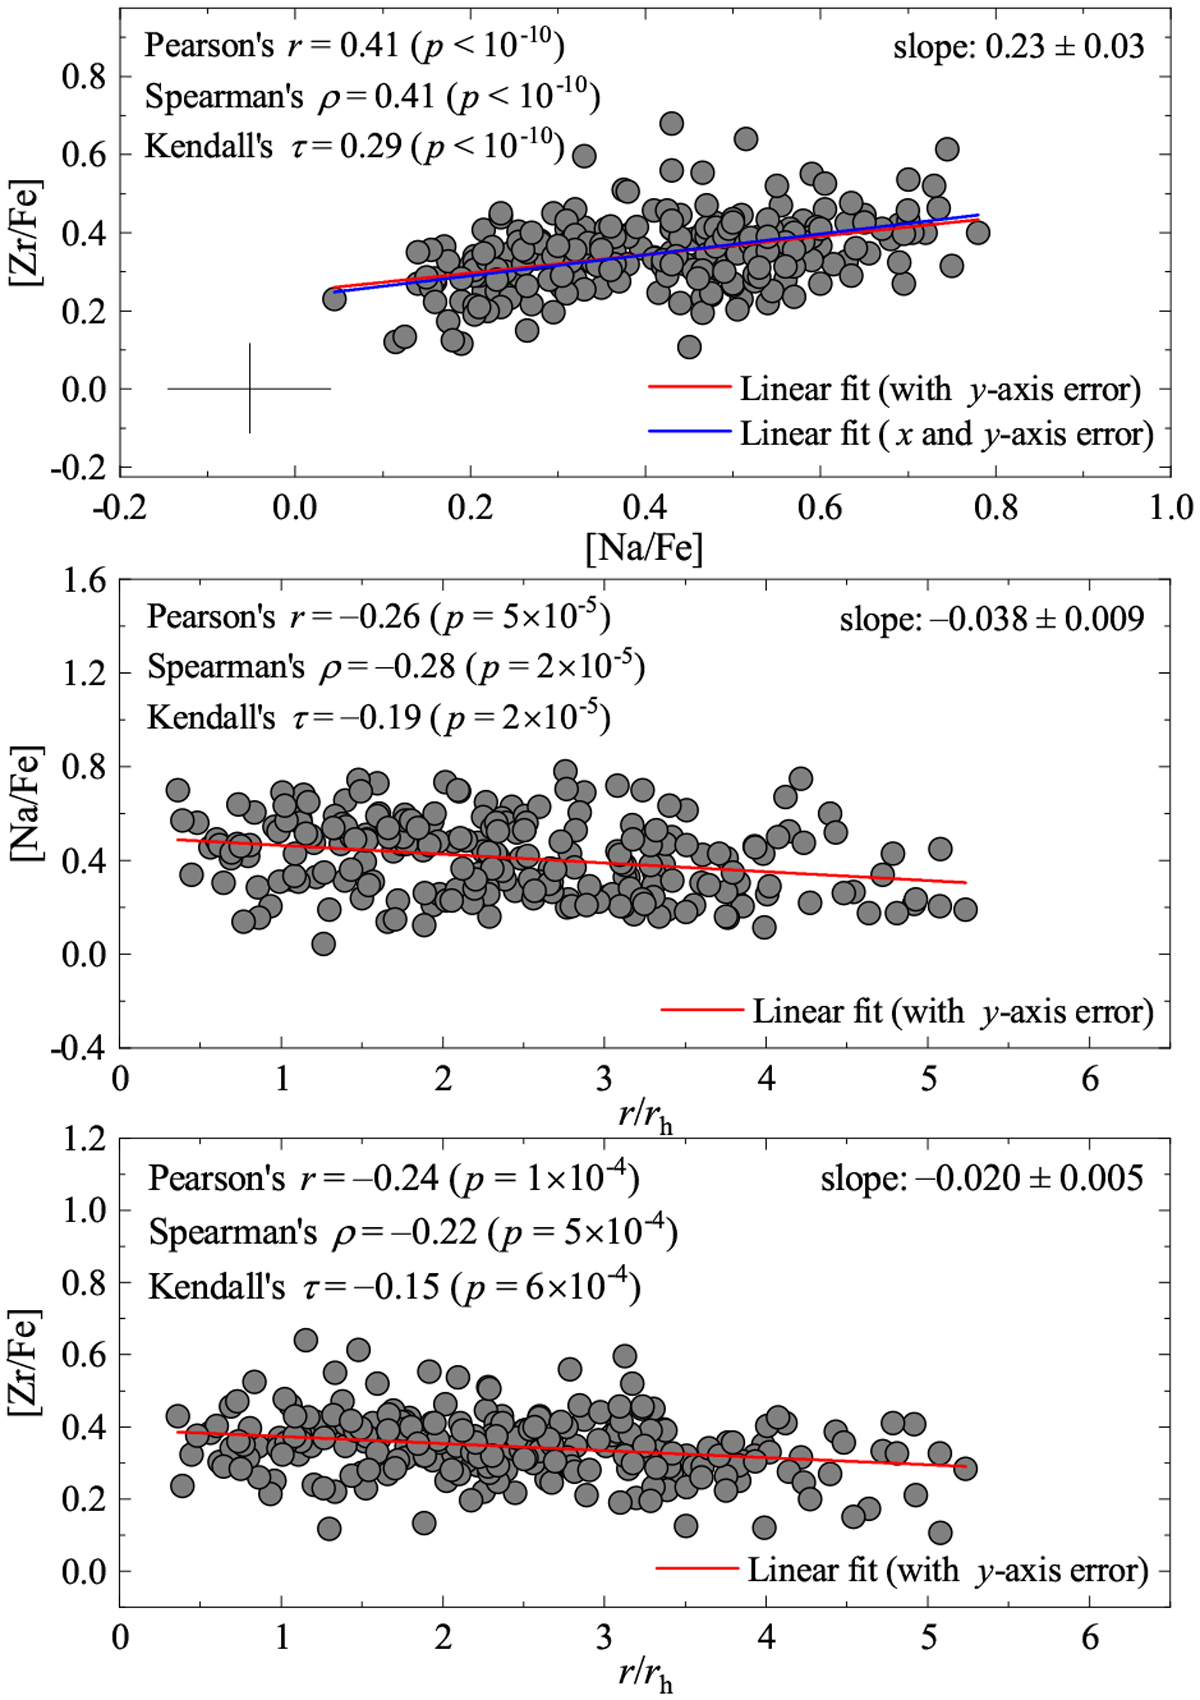
[Zr/Fe] ratios in the sample of 237 RGB stars in 47 Tuc. Top panel: [Zr/Fe] versus [Na/Fe] ratios. Middle and bottom panels, respectively: [Zr/Fe] and [Na/Fe] ratios versus projected distance from the cluster centre, r/rh. Linear least-square best fits are shown as solid lines, fit parameters, correlation coefficients, and the p-values are provided in each individual panel. Typical errors of the individual abundance measurements are indicated in the top panel.
Current usage metrics show cumulative count of Article Views (full-text article views including HTML views, PDF and ePub downloads, according to the available data) and Abstracts Views on Vision4Press platform.
Data correspond to usage on the plateform after 2015. The current usage metrics is available 48-96 hours after online publication and is updated daily on week days.
Initial download of the metrics may take a while.