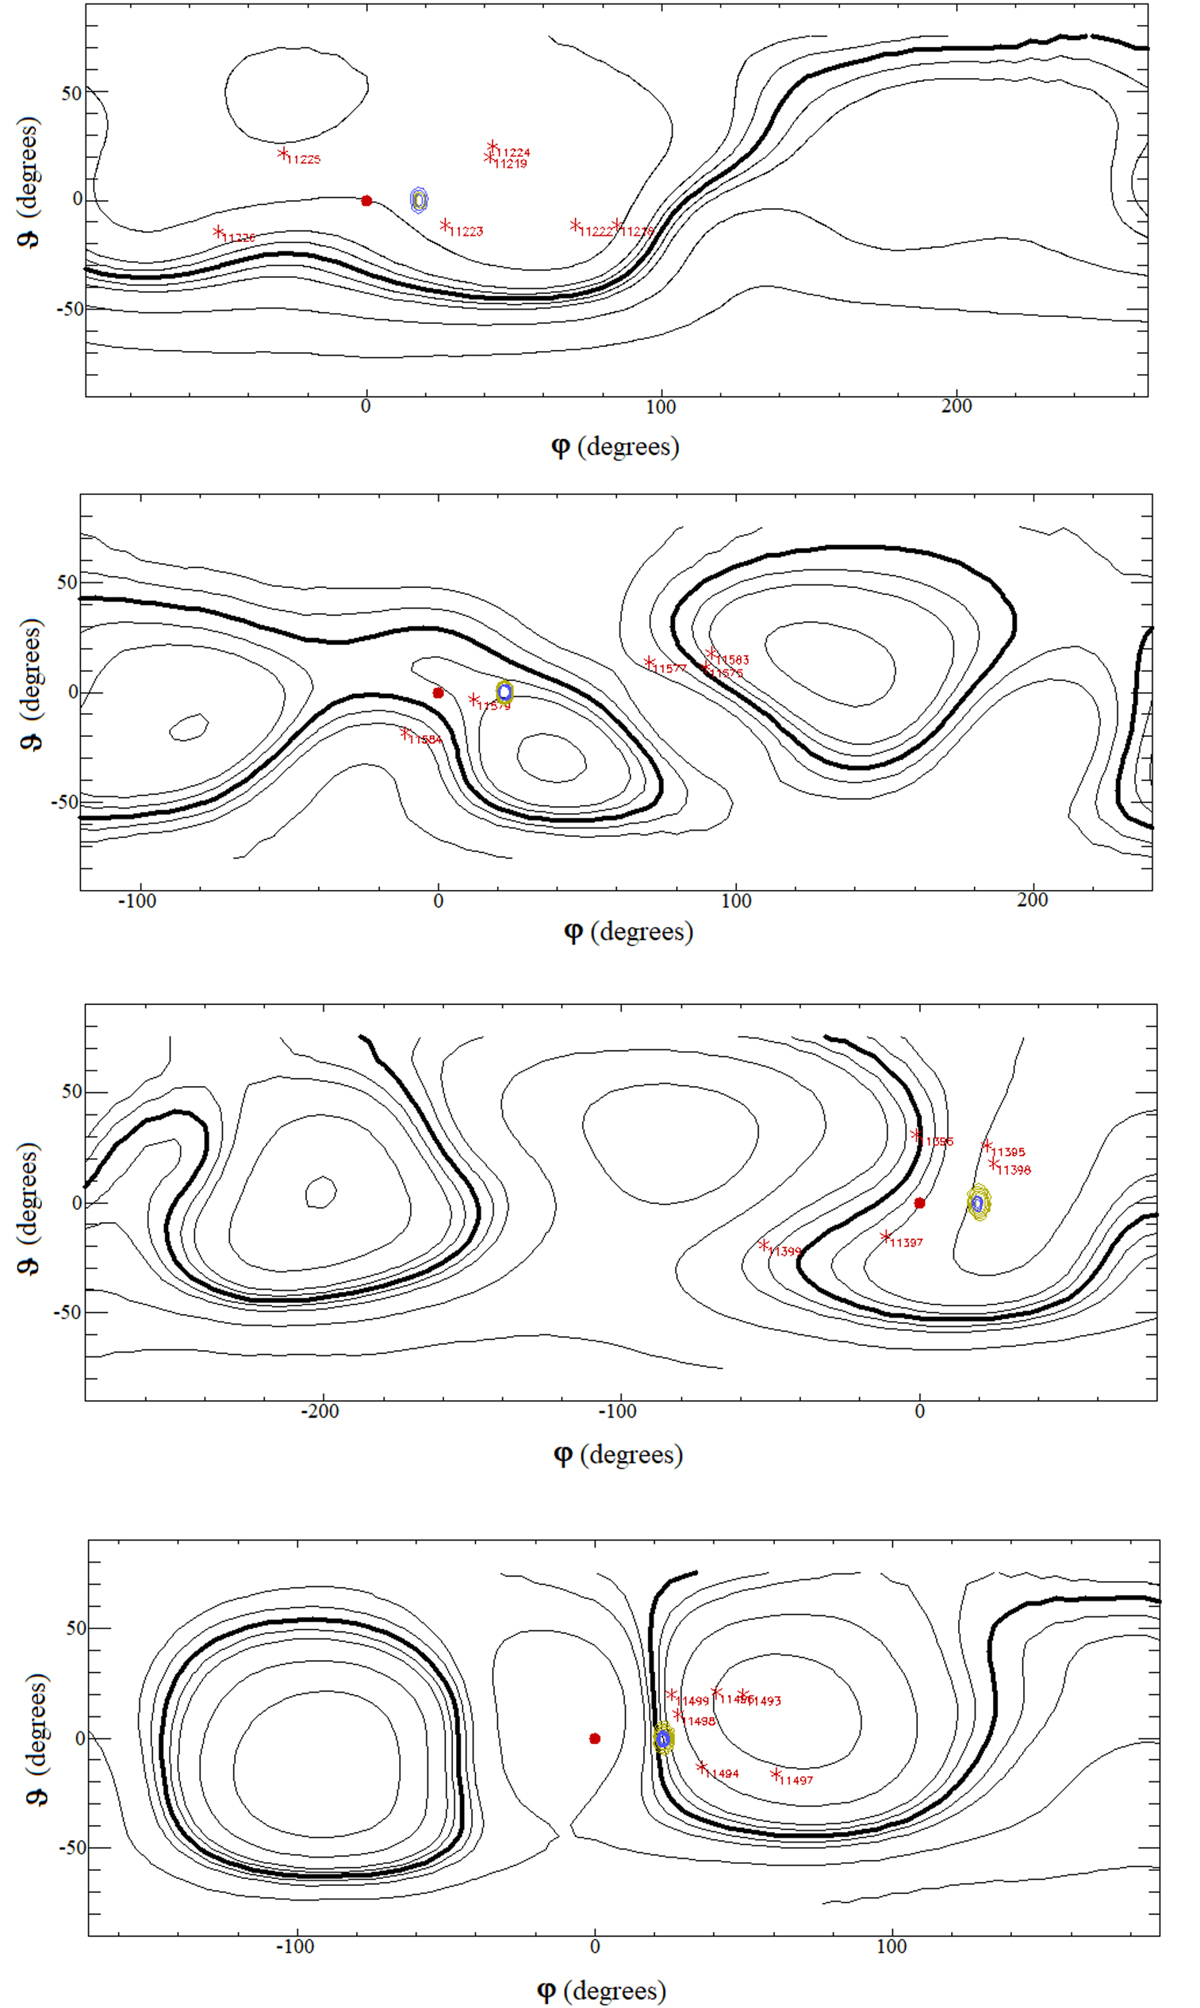
Fig. 3.
Download original image
Magnetic footpoints of Mercury plotted on the solar surface (4 solar radii) with contour lines. The footpoints were computed, from top to bottom, for 5 June 2011, 20 September 2012, 27 January 2012, and 26 May 2012. Each panel also reports the relative position of Mercury (red spot) and of the solar active regions (red asterisks), all projected on the solar magnetic configuration at the source surface (r = 2.5 R⊙) magnetograms as seen by the planet, and retrieved from the Wilcox Solar Observatory data. Blue contour lines represent the magnetic footpoint of Mercury before the occurrence of the CME, computed with the values of the IMF recorded by MAG-MESSENGER on the two days before the event. The φ coordinate represents the heliospheric longitude considering a complete Carrington rotation (360°). The zero is set in correspondence of the planet projection on the solar disk. The ϑ coordinate is the heliospheric latitude. Solid green contour lines represent the magnetic footpoint of the planet after the occurrence of the CME, computed with the values of the IMF recorded by MAG-MESSENGER on the day when the event was observed. The thick solid line represents the magnetic equator of the Sun.
Current usage metrics show cumulative count of Article Views (full-text article views including HTML views, PDF and ePub downloads, according to the available data) and Abstracts Views on Vision4Press platform.
Data correspond to usage on the plateform after 2015. The current usage metrics is available 48-96 hours after online publication and is updated daily on week days.
Initial download of the metrics may take a while.