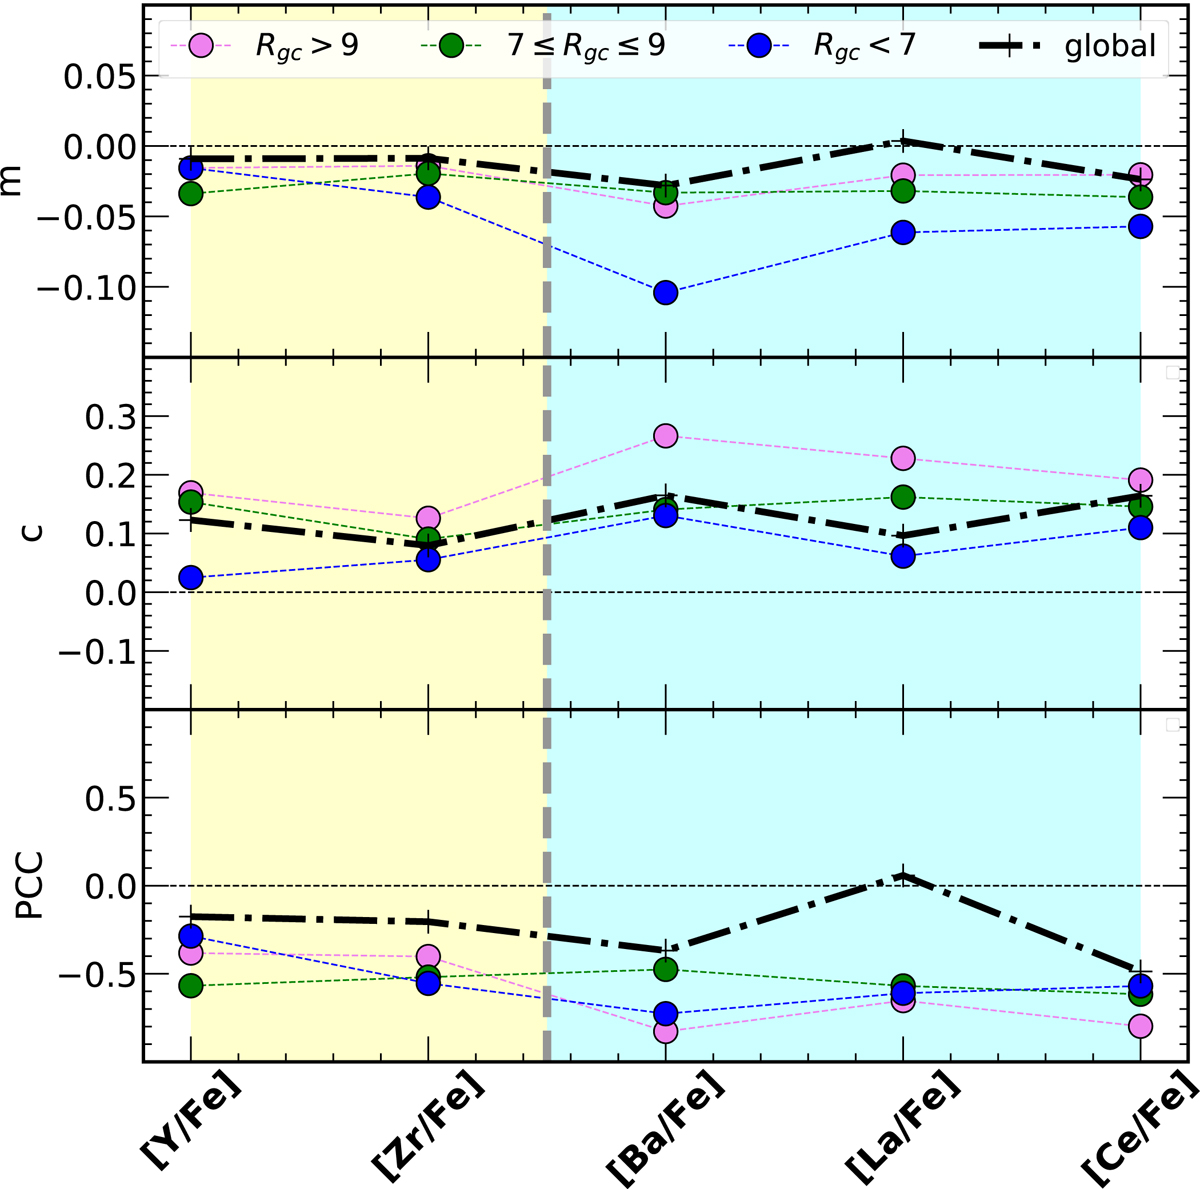
Fig. 4.
Download original image
Weighted regression coefficients for the age versus [El/Fe] relation of 62 OCs by RGC. The yellow area corresponds to the elements of the first s-process peak (Y and Zr), and the cyan area corresponds to those of the second peak (Ba, La and Ce). In the upper panel, we show the slope in dex Gyr−1 of the relations. In the central panel, we present the value of the intercept (dex), while in the bottom panel we see the correlation coefficient. In all panels, we use the following symbols: blue circles for the inner region, green circles for the solar region, pink circles for the outer region, and dashed black lines for the whole sample.
Current usage metrics show cumulative count of Article Views (full-text article views including HTML views, PDF and ePub downloads, according to the available data) and Abstracts Views on Vision4Press platform.
Data correspond to usage on the plateform after 2015. The current usage metrics is available 48-96 hours after online publication and is updated daily on week days.
Initial download of the metrics may take a while.