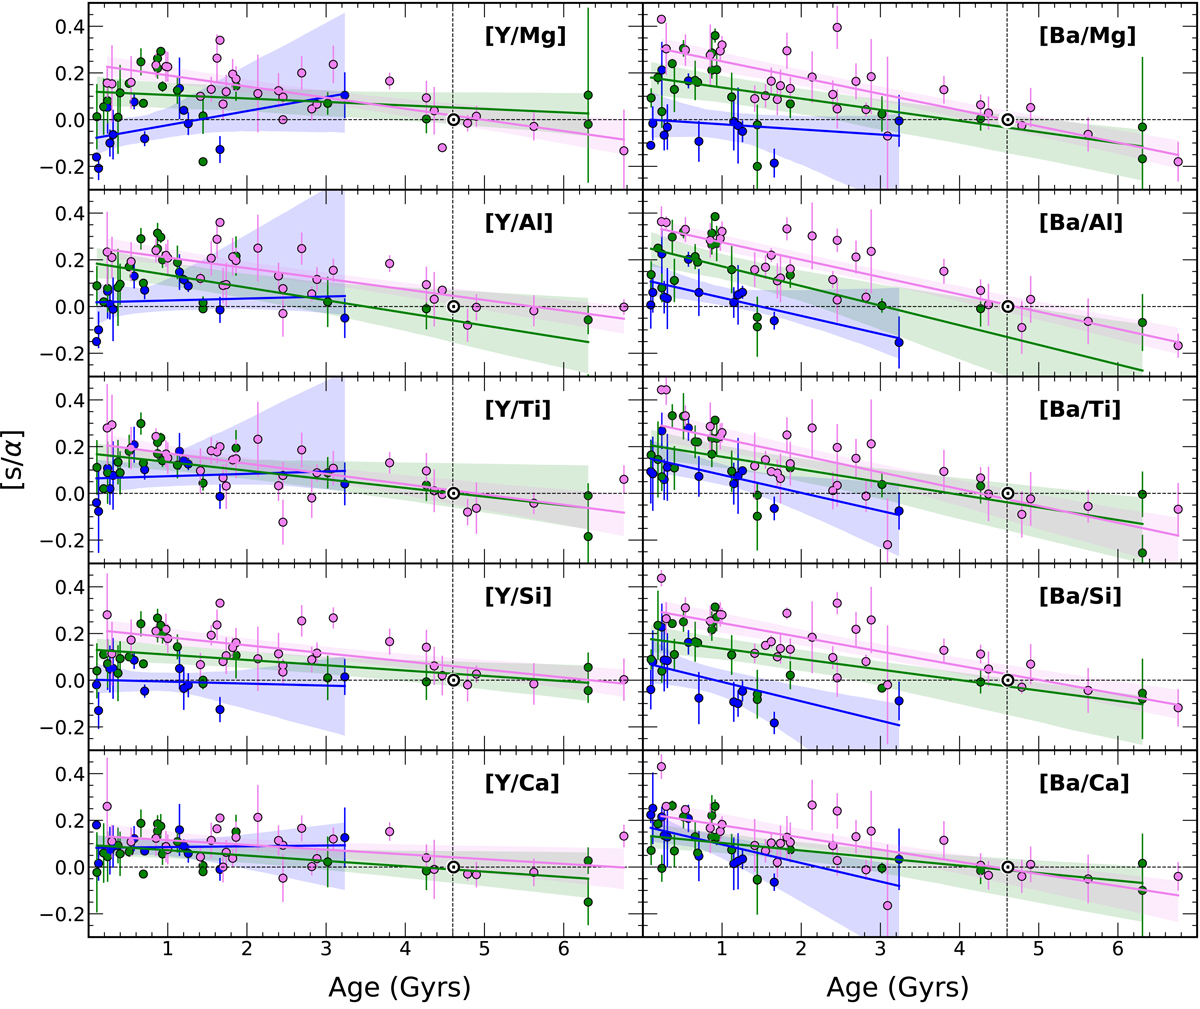
Fig. 5.
Download original image
Age versus [s/α] for our OC sample divided among the three RGC regions. The regression curves with their confidence intervals (shaded regions) are shown in each panel. On the left side, we have the abundance ratios [Y/α] versus age, and on the right side we have [Ba/α] versus age. The symbols and colours are the same as in Fig. 3.
Current usage metrics show cumulative count of Article Views (full-text article views including HTML views, PDF and ePub downloads, according to the available data) and Abstracts Views on Vision4Press platform.
Data correspond to usage on the plateform after 2015. The current usage metrics is available 48-96 hours after online publication and is updated daily on week days.
Initial download of the metrics may take a while.