Fig. 6.
Download original image
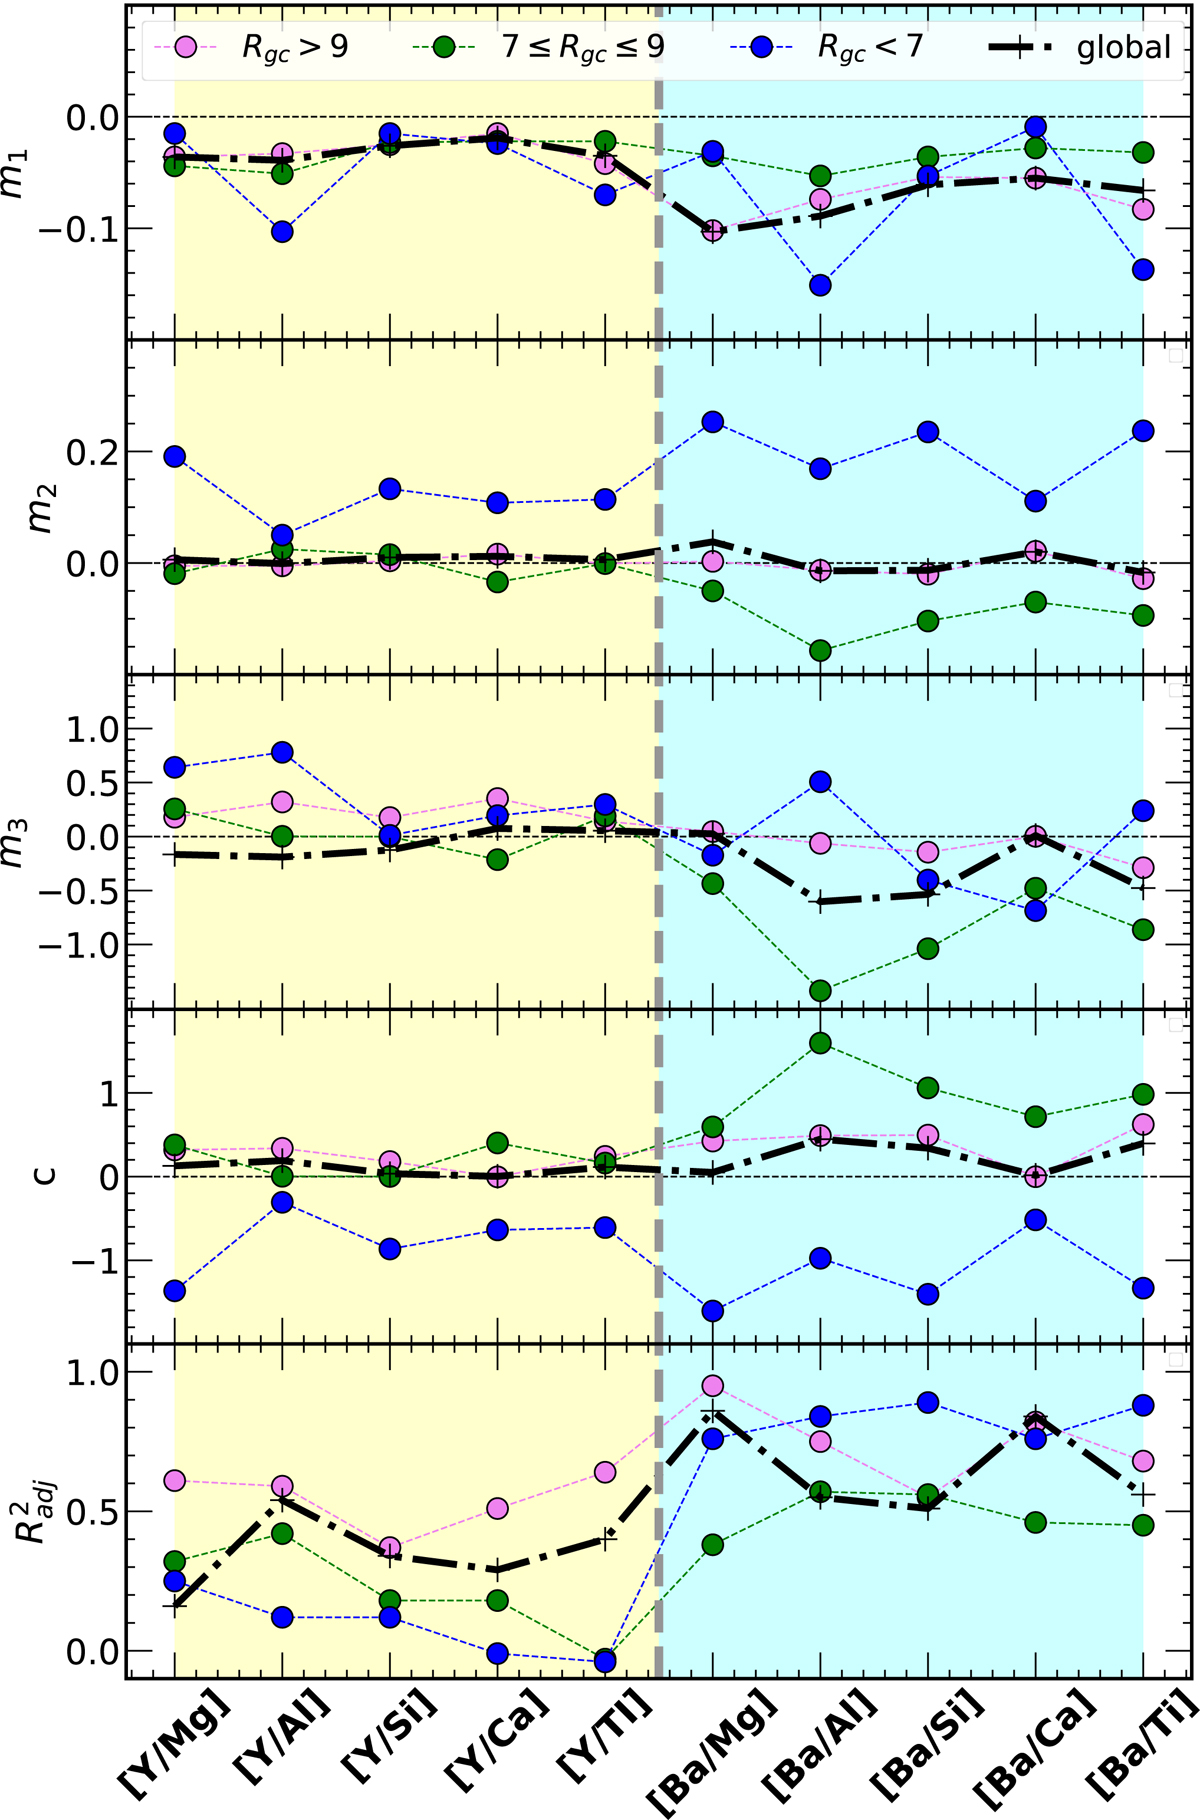
Regression coefficients for the [s-/α] = m1⋅age + m2 ⋅ RGC + m3⋅ [Fe/H] + c relation. We show m1 in the upper panel, m2 in the second one, m3 in the third one, and c in the fourth one. In the bottom panel, we present the correlation coefficients. In all panels, we use the following symbols: blue circles for the inner region, green circles for the solar region, pink circles for the outer region, and dashed black lines for the whole sample. The yellow region highlights the abundance ratios with Y, and the cyan region shows them with Ba.
Current usage metrics show cumulative count of Article Views (full-text article views including HTML views, PDF and ePub downloads, according to the available data) and Abstracts Views on Vision4Press platform.
Data correspond to usage on the plateform after 2015. The current usage metrics is available 48-96 hours after online publication and is updated daily on week days.
Initial download of the metrics may take a while.