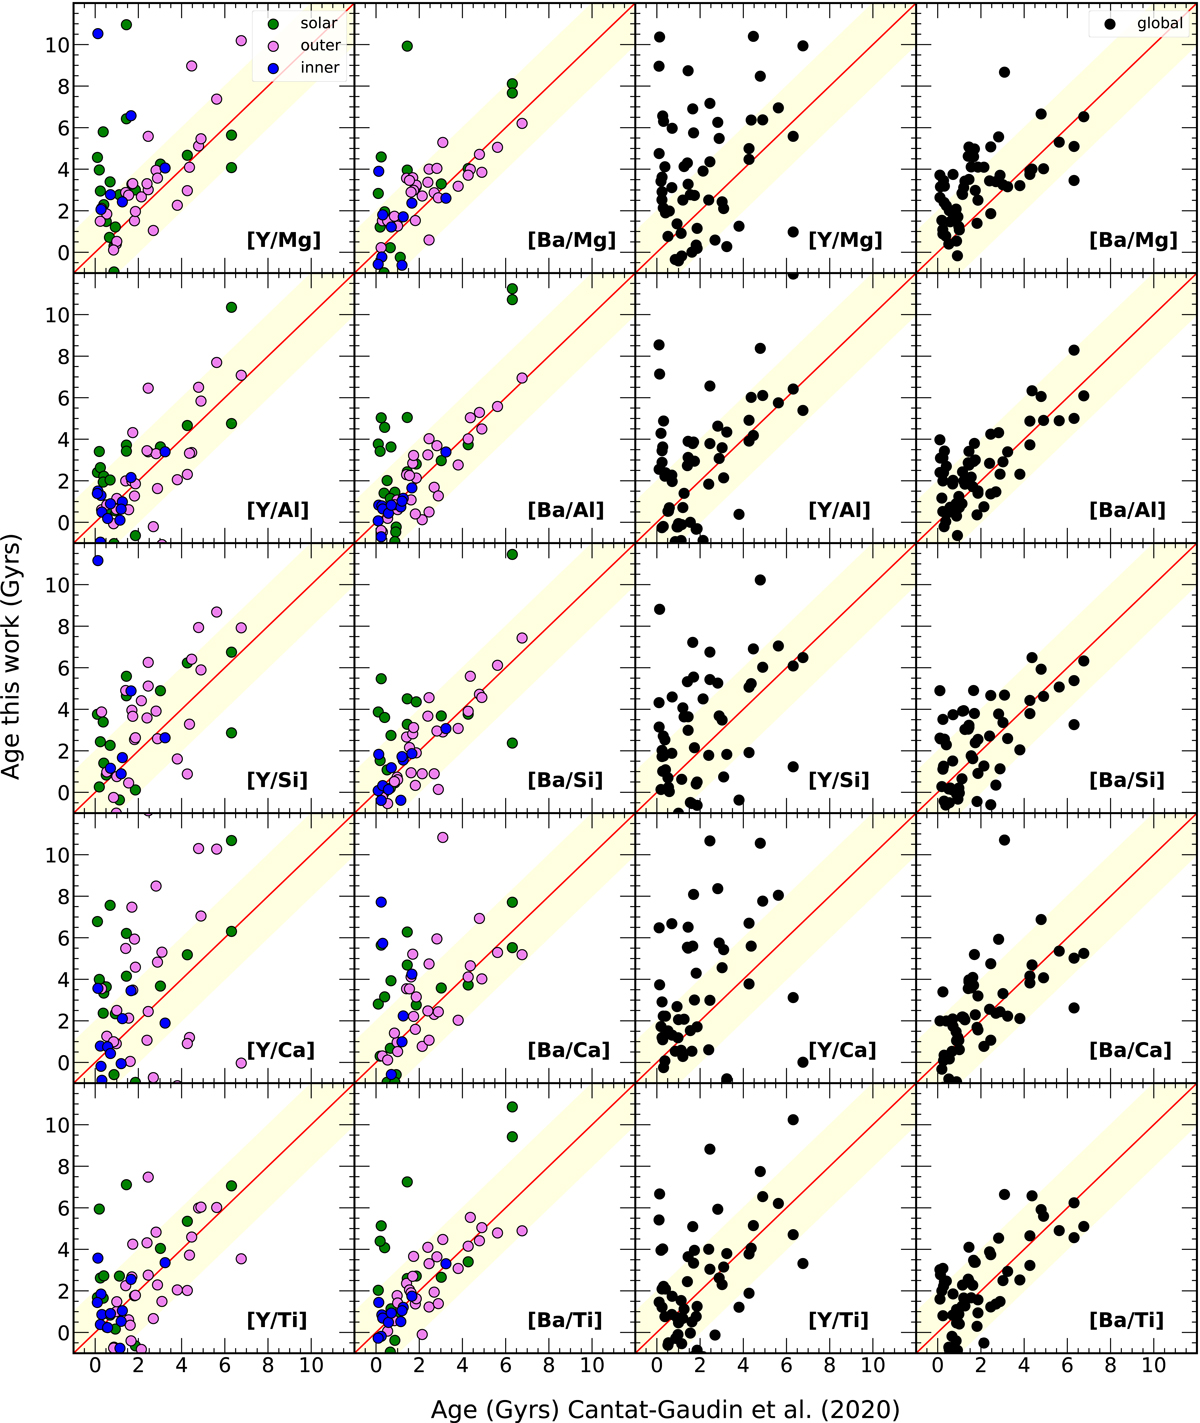
Fig. 8.
Download original image
Ages computed with our relations versus ages from isochrone fitting (Cantat-Gaudin et al. 2020). In the left panels, we show the ages computed with the relations obtained for each radial region. The clusters are colour-coded by RGC. In the two right panels, we show the ages computed with global relations versus the ages from Cantat-Gaudin et al. (2020). The red continuous line is the bisector and indicates the 1-to-1 relation. The yellow shaded regions indicate the clusters with ages within 2 Gyr from their age from the isochrone fitting.
Current usage metrics show cumulative count of Article Views (full-text article views including HTML views, PDF and ePub downloads, according to the available data) and Abstracts Views on Vision4Press platform.
Data correspond to usage on the plateform after 2015. The current usage metrics is available 48-96 hours after online publication and is updated daily on week days.
Initial download of the metrics may take a while.