Fig. 9.
Download original image
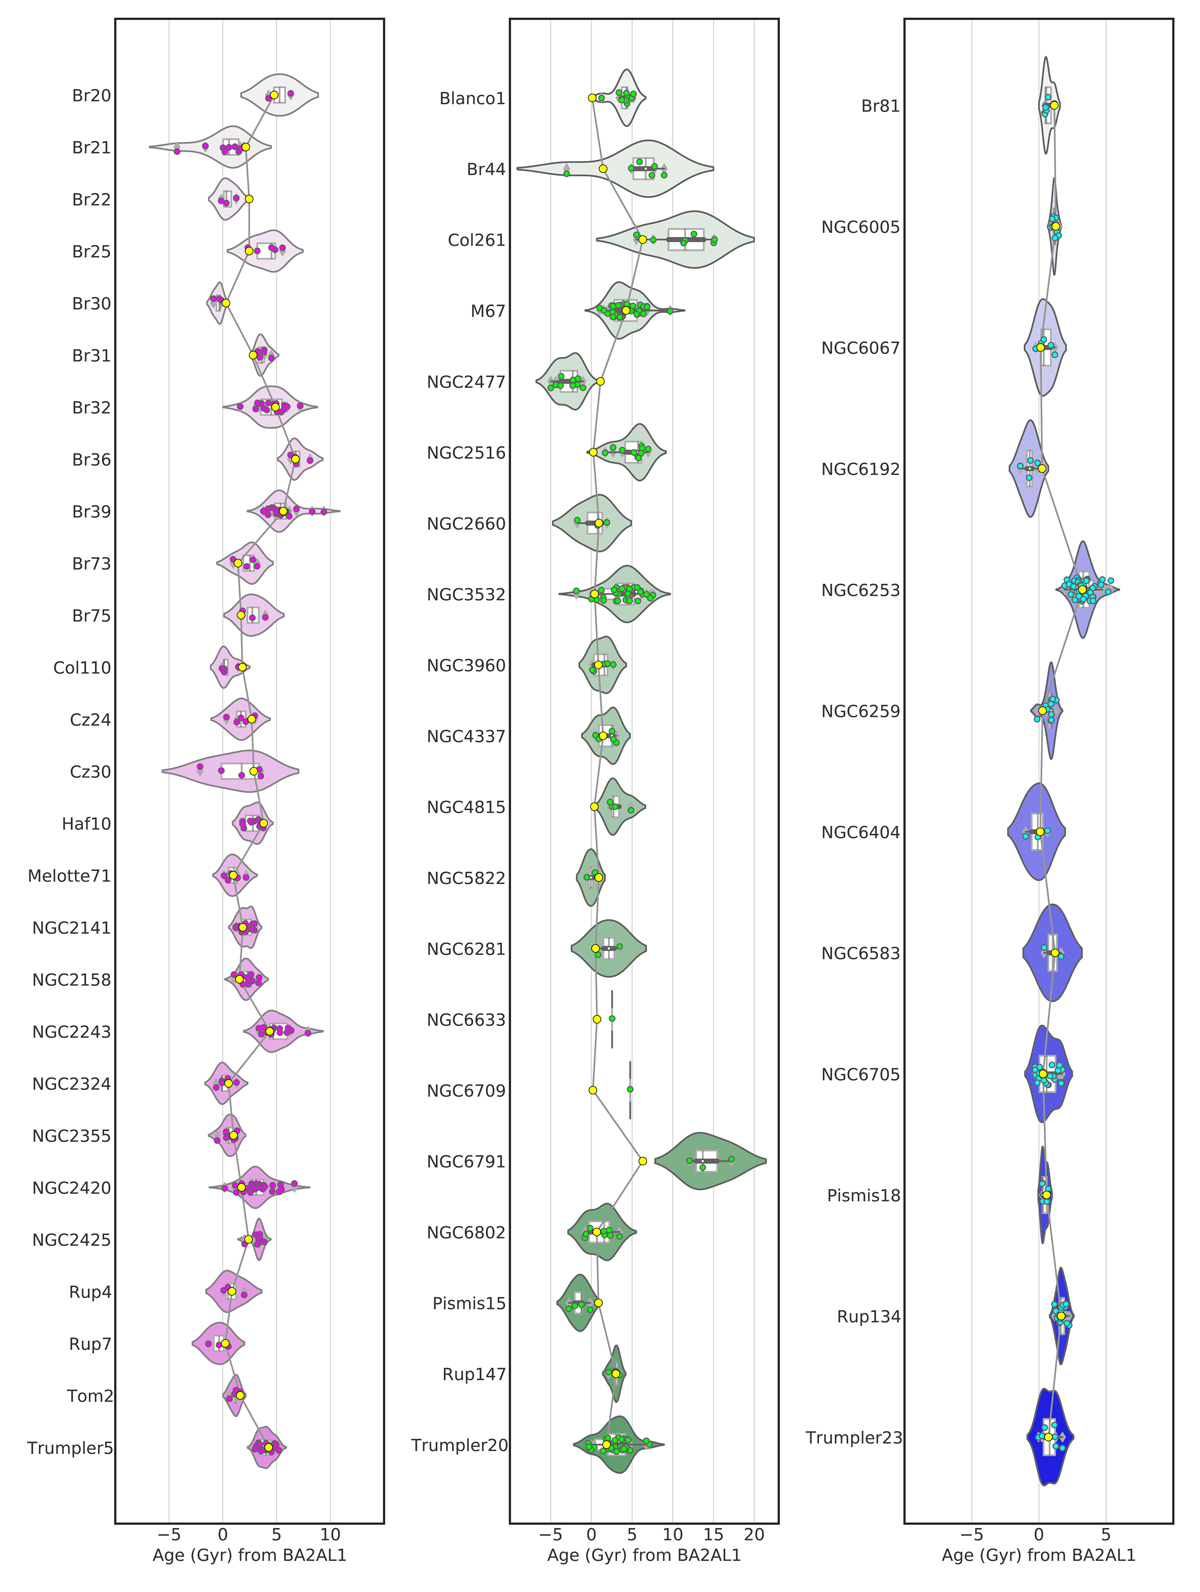
Violin plots of the ages of each stellar member of the clusters calculated using the relations inferred from [Ba/Al] for each of the three regions. Each of the coloured dots represents the age of each member star calculated individually, while the yellow dot is the age from Cantat-Gaudin et al. (2020) for each of the clusters. The thick white bar in the center represents the interquartile range and the thin grey line represents the 1.5 × IQR, also showing a kernel density estimation with the distribution shape of the data. The left panel shows the clusters in the outer disc, the central panel those in the solar region, and the right one the inner disc clusters.
Current usage metrics show cumulative count of Article Views (full-text article views including HTML views, PDF and ePub downloads, according to the available data) and Abstracts Views on Vision4Press platform.
Data correspond to usage on the plateform after 2015. The current usage metrics is available 48-96 hours after online publication and is updated daily on week days.
Initial download of the metrics may take a while.