Fig. 10
Download original image
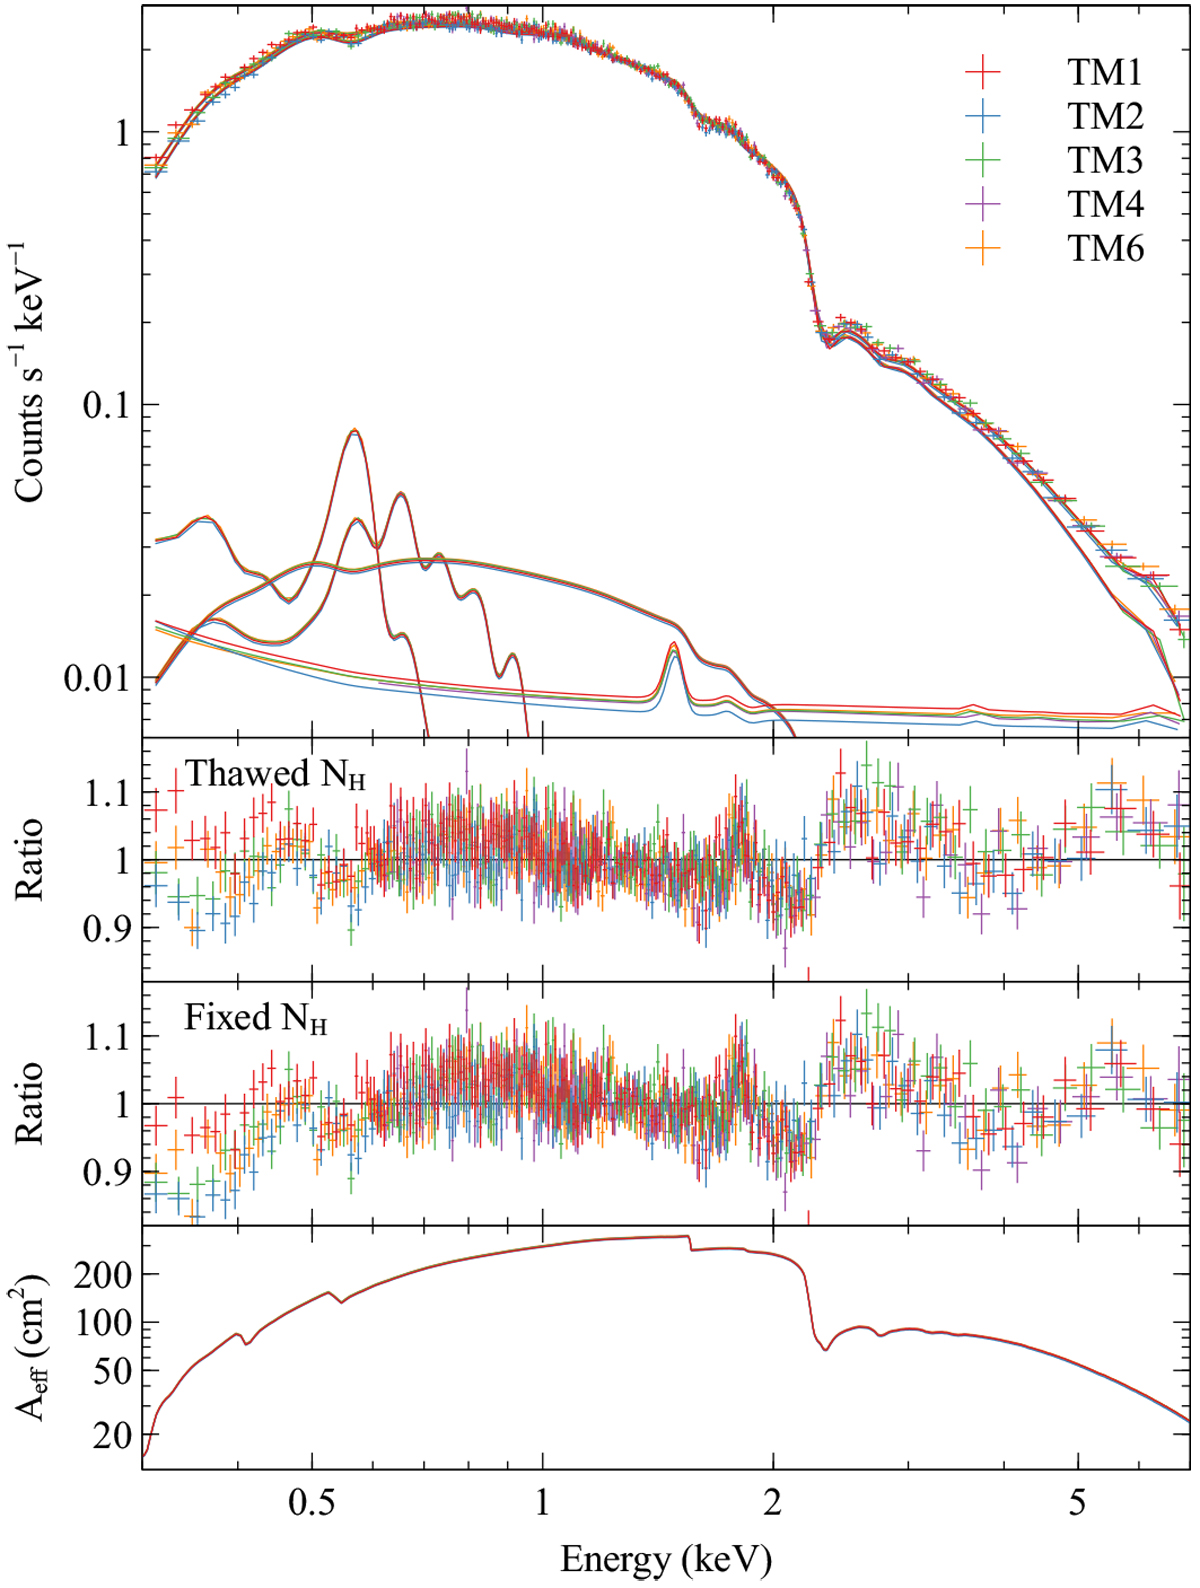
Spectrum of the central 6 arcmin radius around the cluster centre. The data were rebinned to have a signal to noise ratio of 30 in each spectral bin for display purposes. In the top panel are the data, total model, cluster model, XRB components, and NXB in each TM. The second panel shows the residuals after thawing the absorbing column density parameter. The third panel shows the residuals with the column density fixed to be the corrected HI4PI value. The fourth panel shows the average effective area of the TMs as a function of energy over the extraction region based on the source model.
Current usage metrics show cumulative count of Article Views (full-text article views including HTML views, PDF and ePub downloads, according to the available data) and Abstracts Views on Vision4Press platform.
Data correspond to usage on the plateform after 2015. The current usage metrics is available 48-96 hours after online publication and is updated daily on week days.
Initial download of the metrics may take a while.