Fig. A.1
Download original image
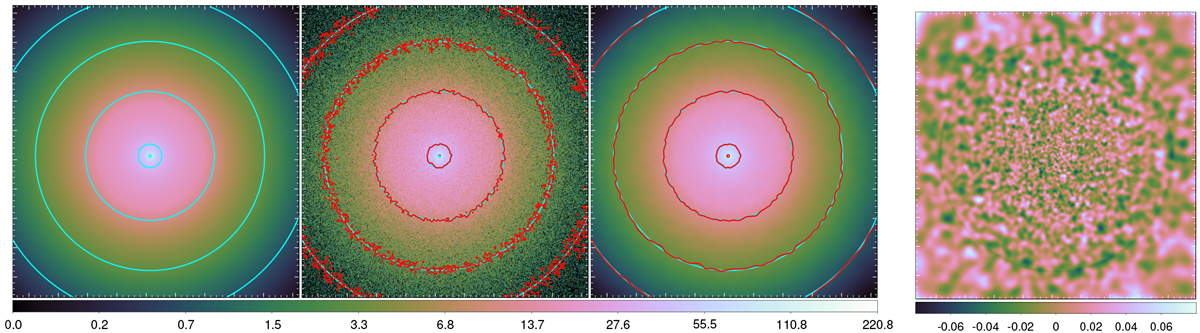
Surface brightness images and residuals. (Left panel) Input surface brightness model, with five logarithmic cyan contours between 1 and 100 counts per pixel. (Second panel) Poisson realisation of input model (signal to noise ratio of 30). Shown are the model contours with red contours at the same levels. (Third panel) Reconstruction of input model using adaptive smoothing. Shown are the model contours with red contours at the same levels. (Right panel) Fractional difference between reconstructed image and input model.
Current usage metrics show cumulative count of Article Views (full-text article views including HTML views, PDF and ePub downloads, according to the available data) and Abstracts Views on Vision4Press platform.
Data correspond to usage on the plateform after 2015. The current usage metrics is available 48-96 hours after online publication and is updated daily on week days.
Initial download of the metrics may take a while.