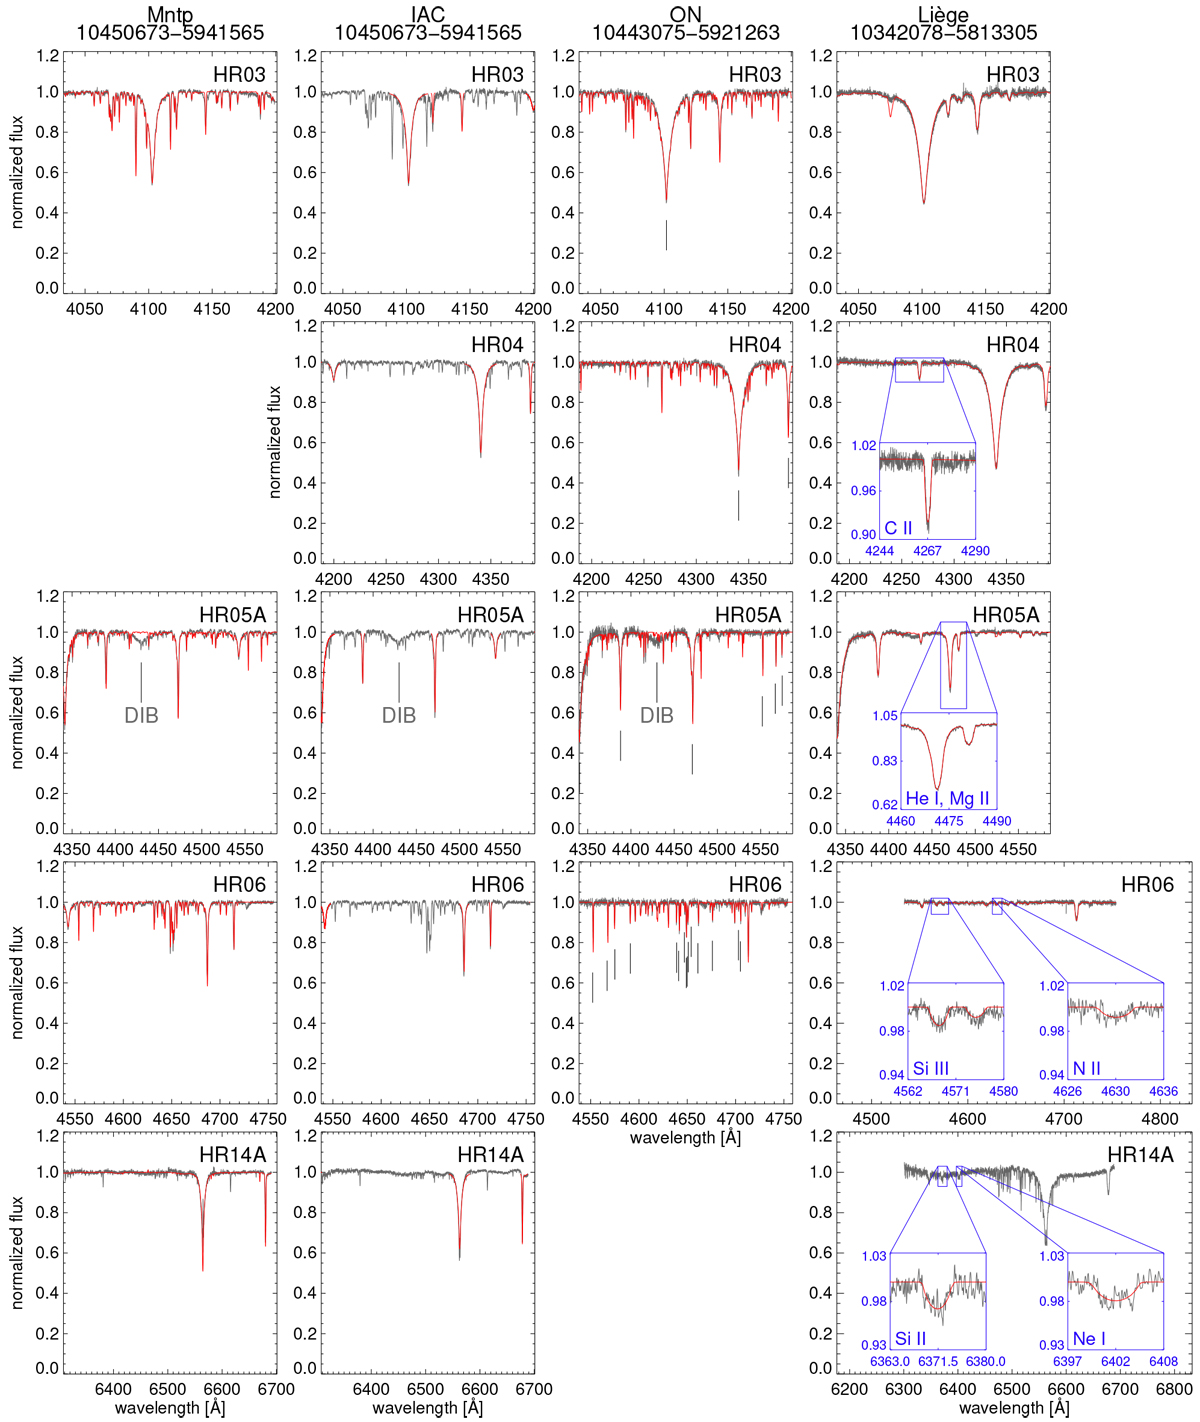
Fig. A.1
Download original image
Examples of GIRAFFE spectra and the fits provided by some of the Nodes. Each column of panels contains the data for a single star as analysed by one of the Nodes (see labels at the top of the columns). Each row of panels shows a specific GIRAFFE setup. In some cases setups were not observed or were not included in the analysis of a specific Node. The black line shows the observed spectrum, the red line the best fit. The IAC Node only fitted selected hydrogen and helium lines. For the ON Node a full theoretical spectrum is plotted, but only the spectral lines indicated with tick marks were used in the χ2 calculation and the abundance determination. Some of the HR05A spectra show a prominent diffuse interstellar band at 4430 Å. Insets for the Liège Node show the fit of specific lines that were used for abundance determination.
Current usage metrics show cumulative count of Article Views (full-text article views including HTML views, PDF and ePub downloads, according to the available data) and Abstracts Views on Vision4Press platform.
Data correspond to usage on the plateform after 2015. The current usage metrics is available 48-96 hours after online publication and is updated daily on week days.
Initial download of the metrics may take a while.