Fig. 3
Download original image
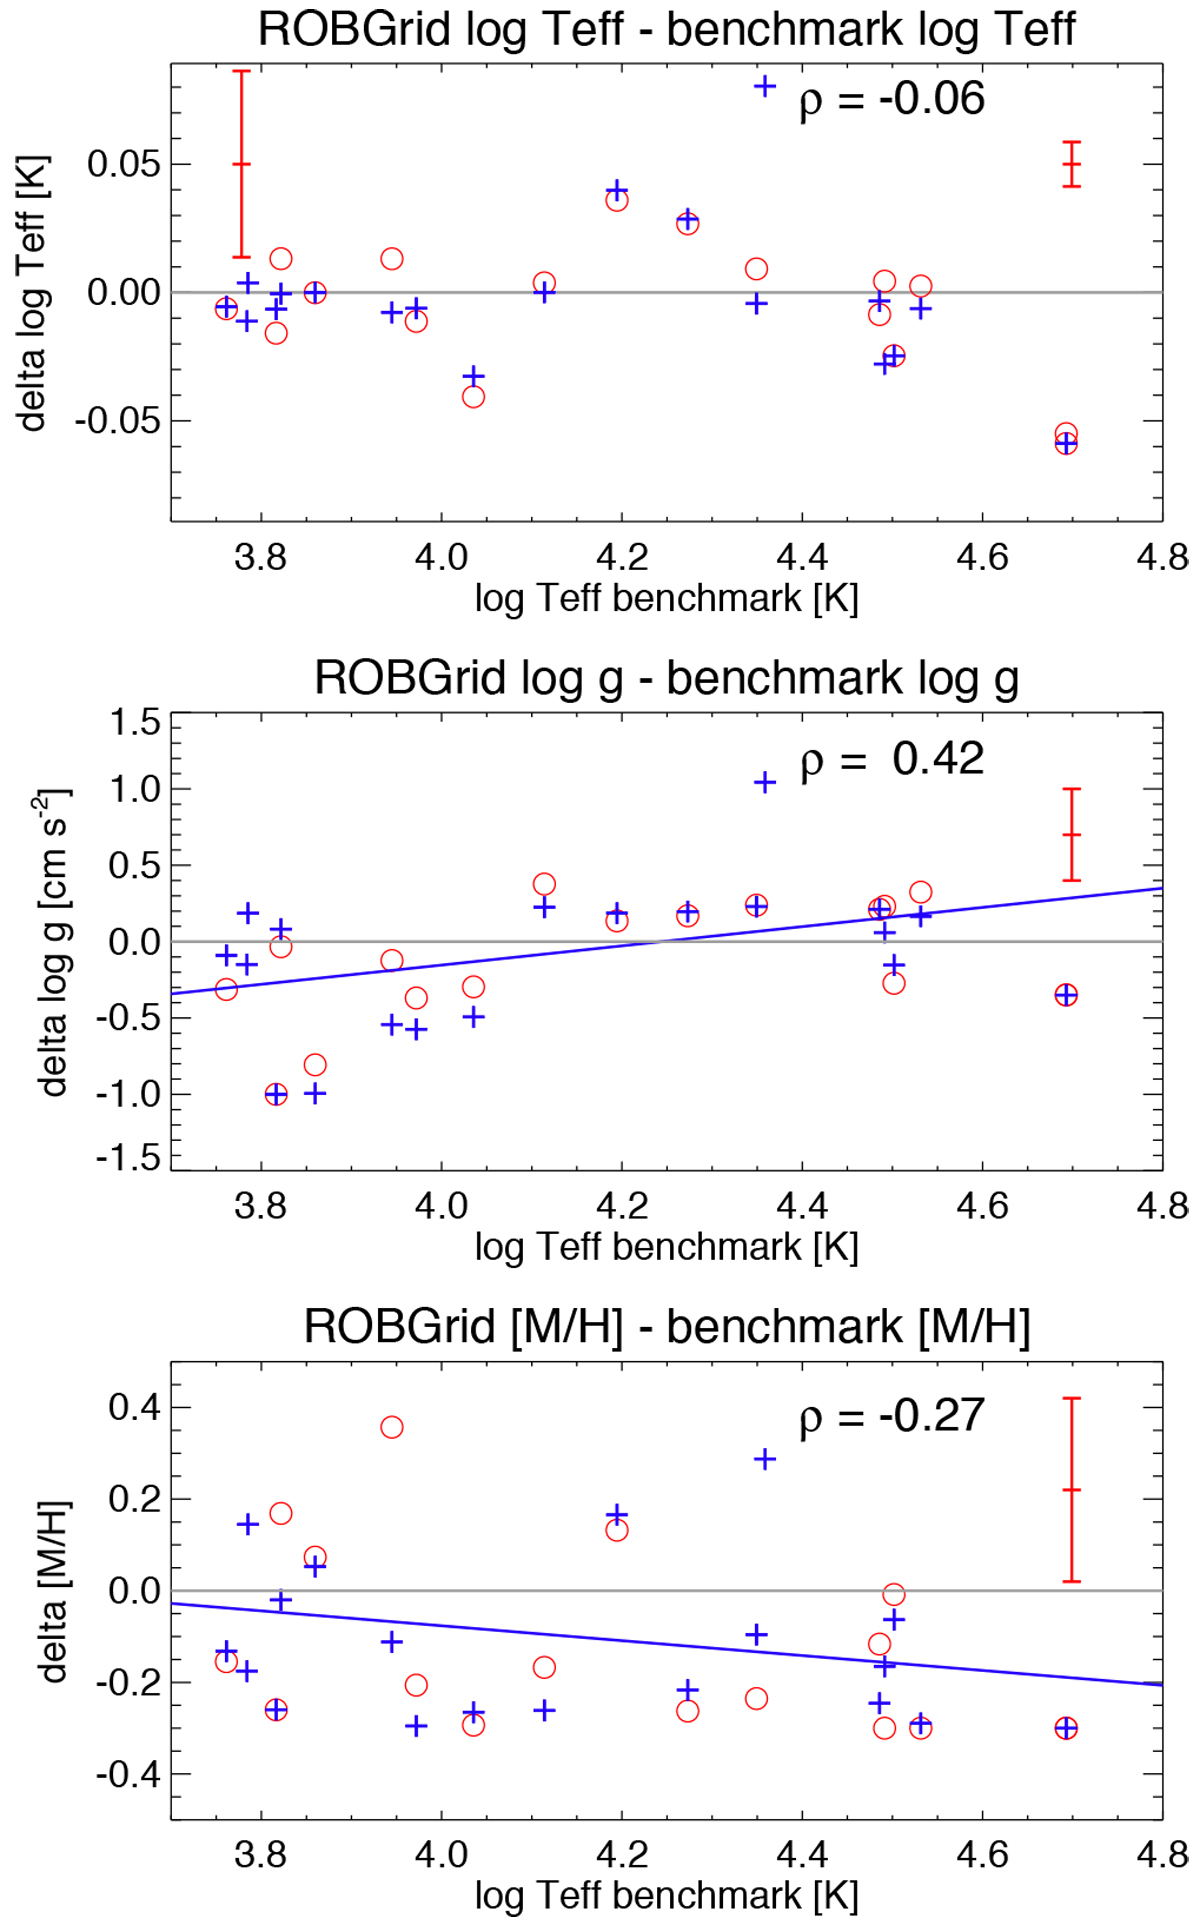
Differences in log Teff (top panel), log g (middle panel), and metallicity (bottom panel) between the ROBGrid values and the benchmark values, as a function of log Teff. Some of the cooler benchmark stars are also analysed by ROBGrid (see Sect. 4.1). GIRAFFE values are shown as red circles, UVES values as blue plus signs. Typical 1σ uncertainties are indicated on the plot (two for log Teff, representative of cooler stars and of the hottest ones). The blue lines are linear fits to the averaged GIRAFFE + UVES values. These fits are used to correct all ROBGrid log g and metallicity values in the homogenisation phase. The Pearson correlation coefficient (ρ) is also shown in each panel.
Current usage metrics show cumulative count of Article Views (full-text article views including HTML views, PDF and ePub downloads, according to the available data) and Abstracts Views on Vision4Press platform.
Data correspond to usage on the plateform after 2015. The current usage metrics is available 48-96 hours after online publication and is updated daily on week days.
Initial download of the metrics may take a while.