Fig. E.1.
Download original image
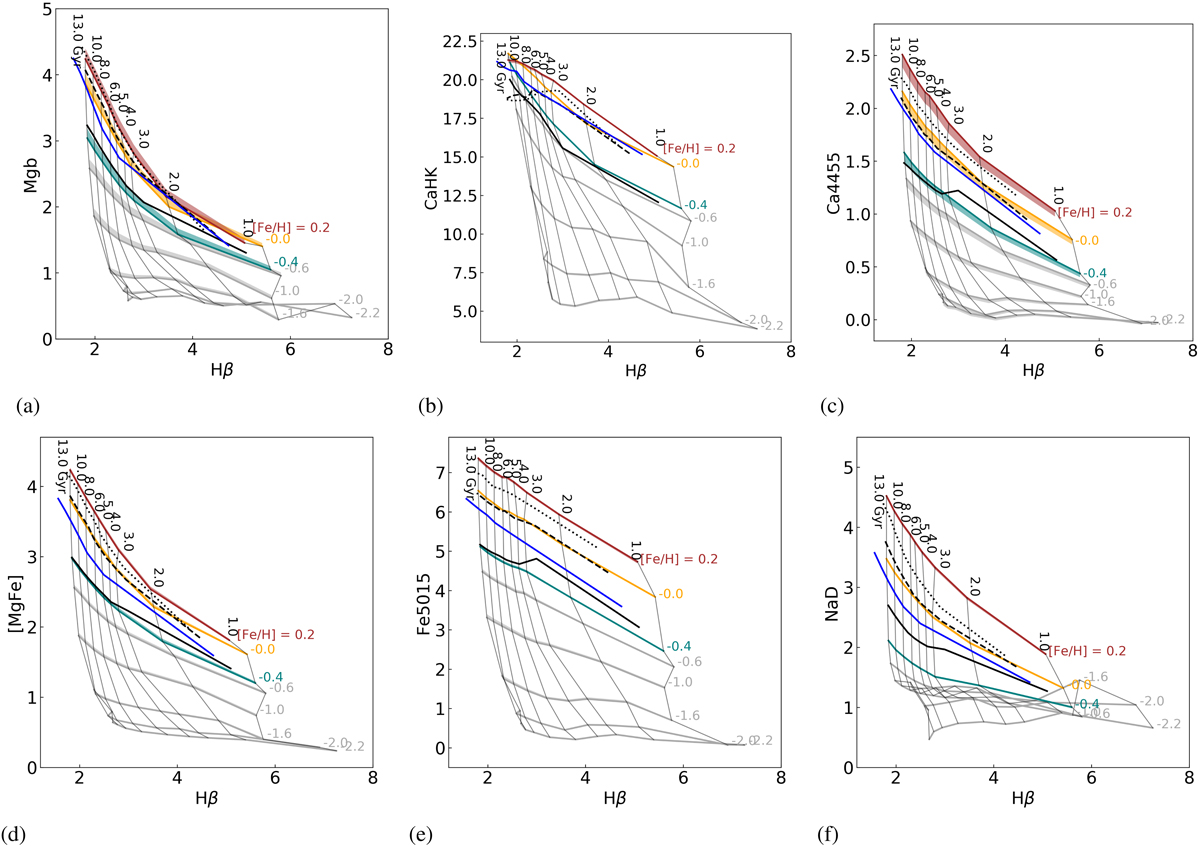
Comparison of the behaviour of the Mgb, CaHK, Ca4455, [MgFe], Fe5015, and NaD absorption-line indices as a function of the Hβ index. The shaded areas represent XSL PARSEC/COLIBRI models, with spectral resolution varying from σ = 13 km s−1 (the XSL native resolution) to σ = 60 km s−1 (the minimum E-MILES resolution in the optical). Black lines represent E-MILES BaSTI model predictions, with dotted, dashed, and solid lines representing [Fe/H] = +0.2, 0.0, and −0.4 dex, respectively, measured at the original E-MILES resolution. The solid blue line represents the predictions of the C18 solar-metallicity models.
Current usage metrics show cumulative count of Article Views (full-text article views including HTML views, PDF and ePub downloads, according to the available data) and Abstracts Views on Vision4Press platform.
Data correspond to usage on the plateform after 2015. The current usage metrics is available 48-96 hours after online publication and is updated daily on week days.
Initial download of the metrics may take a while.